
 Español
April 30th, 2019
Last week we showed in this post how big data from household electricity meters can be used to estimate measures of energy poverty and inequality at the municipal level in Bolivia. The objective of this blog is to show how electricity meter data can also be used to infer information about recent population dynamics in the country. Such information is not just of interest from a sustainable development perspective, but it also provides valuable information to orient both public and private investments.
A simple way to identify the most attractive municipalities in Bolivia is to see where the number of residential electricity meters with positive electricity consumption (which suggests inhabited dwellings) is increasing the most. Figure 1 shows the 50 municipalities that have added most residential electricity meters (with positive electricity consumption) between 2013 and 2016. Map 1 shows were these municipalities are located in Bolivia.
Santa Cruz de la Sierra and El Alto lead the table, each adding about 11 thousand electricity meters with positive consumption per year. They are followed by La Paz and Cochabamba each adding about 7 thousand electricity meters per year. Further down we find the other six departmental capitals of Bolivia (black) and most of the municipalities that make up the metropolitan areas of La Paz (red), Santa Cruz (blue) and Cochabamba (green).
The remaining grey municipalities represent what could be called “Growing intermediate municipalitie.” They are not departmental capitals, nor are they part of Bolivia’s three main metropolitan areas, but they are nevertheless attracting quite a lot of people. The intermediate municipalities that attract most people in Bolivia are: Punata, Yacuiba, Montero, Villa Tunari, Riberalta, Villamontes, Caracollo, Yapacaní, Puerto Villarroel, Entre Ríos (Cochabamba), San Ignacio de Velazco, and San Julián; all growing by more than 500 electricity meters per year.
Figure 1: The top 50 most dynamic municipalities in Bolivia, 2013-2016 (as measured by the average annual increase in domestic electricity meters with positive consumption).
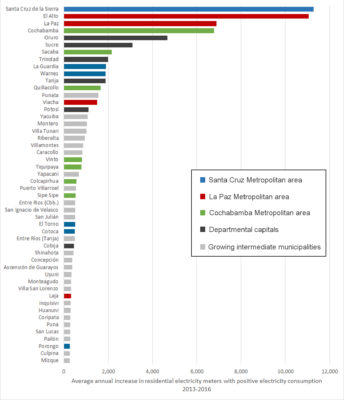
Source: Andersen, Branisa & Calderón (2019)
Map 1: The top 50 most dynamic municipalities in Bolivia, 2013-2016 (as measured by the average annual increase in domestic electricity meters with positive consumption).
 Source: Andersen, Branisa & Calderón (2019), Map kindly produced by Lily Peñaranda
Below the 50 municipalities listed in Figure 1 are 289 other municipalities that are apparently much less attractive to internal migrants, and which probably have trouble keeping young people of reproductive age to form new households, but very few municipalities have actually seen a decrease in active electricity meters.
As a way of promoting the exchange of information, we encourage readers living in one of the 50 municipalities on the list to comment below about what makes their municipality particularly attractive.
———————————-
* Lykke E. Andersen, Ph.D., Executive Director of SDSN Bolivia at: Lykke.E.Andersen@sdsnbolivia.org.
** Boris Branisa, Ph.D., Director, Instituto para el Desarrollo del Emprendimiento y la Competitividad (iDEC), Escuela de la Producción y la Competitividad (ePC), Universidad Católica Boliviana “San Pablo”.
*** Guillermo Guzmán, Ph.D., Centro de Investigaciones Sociales (CIS) de la Vicepresidencia del Estado.
The viewpoints expressed in the blog are the responsibility of the authors and do not necessarily reflect the position of their institutions. These posts are part of the project “Atlas of the SDGs in Bolivia at the municipal level” that is currently carried out by the Sustainable Development Solutions Network (SDSN) in Bolivia, of which both iDEC and CIS are members.
————————————