
 Español
May 17th, 2023
Context
The aeronautical sector is one of the most important and relevant economic sectors, as it is one of the main ways that tourists travel to Bolivia. However, in actuality, the aeronautical sector in Bolivia faces huge challenges, since Bolivian airports are amongst the five worst in Latin America in terms of aeronautical infrastructure. Moreover, the high operating costs of Bolivian airports, along with the location-specific limitations, such as the high altitude of El Alto International Airport, have stagnated the development of the aeronautical sector.
Inside the commercial aviation industry, the airlines are a massive transporter of passengers and cargo, capable of connecting different destinations. Better and more airline service is thus crucial for the strengthening of new tourist markets and more and more important for attracting tourists on a world-wide scale.
Bolivia relies on three international airports, managed by Aerial Navigation and Bolivian Airports (NAABOL, formerly SABSA), which are found in the cities of Santa Cruz (Viru Viru International Airport), Cochabamba (Jorge Wilsterman International Airport), and La Paz (El Alto International Airport). Before the pandemic, Bolivia’s three international airports had an annual traffic[1] of 1 million, 166 thousand, and 428 thousand passengers respectively (National Institute of Statistics of Bolivia, s.f). These numbers are not very high compared to other nearby countries, which before the pandemic had an approximate annual traffic of 37 million passengers, such as the Colombian airports. It is important to note that this number includes all authorized Colombian airports at this moment (World Bank, s.f).
El Alto International Airport[2] has experienced a decrease in the number of passengers due to the withdrawal of five international airlines in recent years (Avianca, Sky Airline, Peruvian Airlines, American Airlines, and Aerolíneas Argentinas), leaving only one international airline still serving the airport.
Another factor which affects the number of passengers is the actual infrastructure and the location of the airport. According to Fontur’s Final Development Report, carried out in Colombia (FEDESARROLLO, 2016), the capacity of an airline to service an airport depends on various factors, including the airport’s altitude. In the case of El Alto International Airport, its altitude of 4,061 meters above sea level reduces the ability of an airline to service El Alto International Airport. This disadvantage means airlines have to operate with a lower number of passengers. It also requires longer runways and better weather conditions (wind and temperature).
The impact of these factors on El Alto International Airport is shown in Table 1, which shows a comparison between the number of international passengers through the three international Bolivian airports discussed in this report. Table 1 shows that between 2017 and 2018, only Viru Viru Airport registered a 2% increase in the number of passengers, while the El Alto and Jorge Wilsterman Airports registered a decrease of 4% and 2%, respectively. In 2019, the number of passengers declined in all three Bolivian airports.
Table 1: Number of international passengers in the three international airports of Bolivia 2017-2019 (in amount of people)
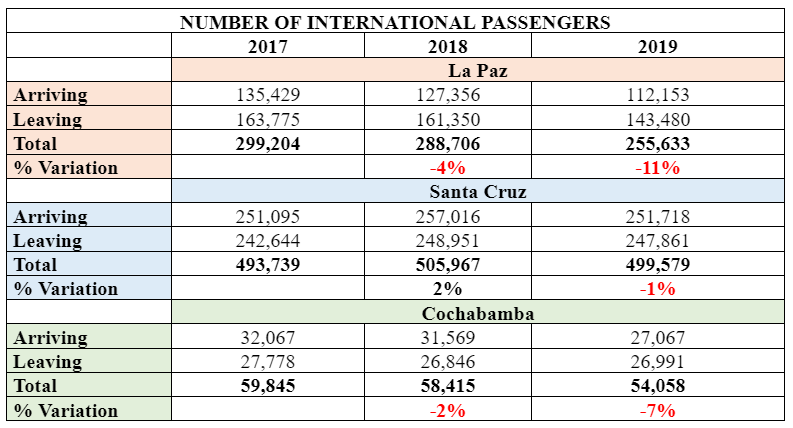
Source: authors’ calculations based on data from the National Institute of Statistics (INE).
Economic incentives to increase the number of tourists
In Latin America, various countries have experienced a decrease in the number of tourists and they have implemented different models to counteract this situation. Among the most popular is the use of economic incentives. Below we present some examples of their implementation:
- In 2018, Argentina gave promotions to decrease airline user fees at the Malvinas Islands International Airport, as well as improving the infrastructure of the runways and of the airport in general (Notife, 2019).
- During the Covid-19 pandemic, Colombia reduced value-added taxes (IVA) for flight tickets and jet fuel for their airports, and suspended operation costs for one year (Brigard Urritia, s.f).
- In 2019, Ecuador implemented a strategy of economic incentives for their airports. The economic incentives consisted of a reduction of up to 40% of airport rent, and lowered landing costs, lighting, flight and parking protection fees by 30 to 70%. All of this was under the Resolution No. DGAC-YA-2019-0005-R, passed in 2019 (Resolution No. DGAC-YA-2019-0005-R) (NL Arenas, 2018).
Other examples include Peru, Uruguay, Paraguay, and Honduras, who also introduced economic incentives, since approximately 2010, and as a result saw an increase in the number of flights and tourists. Figure 1 shows the increasing number of passengers in various other countries of Latin America.
Figure 1: Number of passengers in Latin American airports 2006-2019
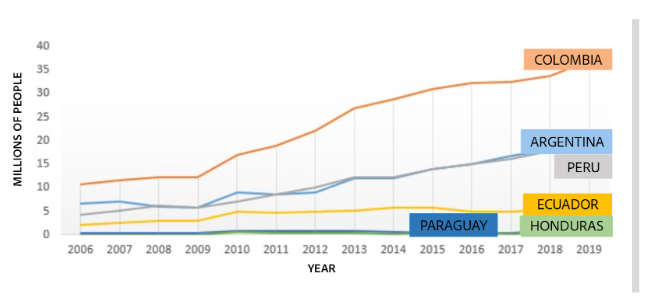
Source: authors’ calculations based on data from the World Bank (2019).
Public policy proposal to develop the airline sector
Using an econometric study, we model three scenarios (a pessimistic prediction, an optimistic prediction, and a third scenario), to shape the airline sector’s public policy, offering incentives to airlines that operate in El Alto International Airport. This proposal intends to reduce significant costs to the airlines, compensating the higher costs the airlines have to incur in order to operate in El Alto International Airport.
The proposed economic incentives include a reduction in the airport exit tax (ISAE), airport fees, and jet fuel cost. Table 2 shows these costs for El Alto International Airport. We should consider that the purpose of the public policy is to increase the number of flights without jeopardizing the government’s tax revenue, as the planned reduction in revenues from these tax cuts can be compensated by increased revenue from additional tourists.
Table 2: Operational costs of El Alto International Airport (in US dollars)
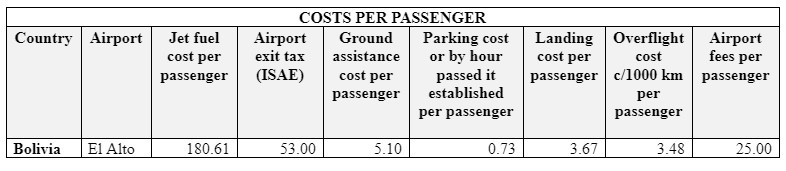
Source: authors’ calculation
Figure 2 shows the predicted number of tourist arrivals in Bolivia under the three scenarios over the next three years. We can conclude from the forecasted behavior that it is imperative to develop new strategies to stimulate the airline industry, because if the current course continues, the number of tourists in Bolivia[3] (lilac line in Figure 2) will continue to decline. This shows the necessity of implementing measures which allow the airport to be more competitive and more attractive to airlines.
Figure 2: Predicted number of tourists over time
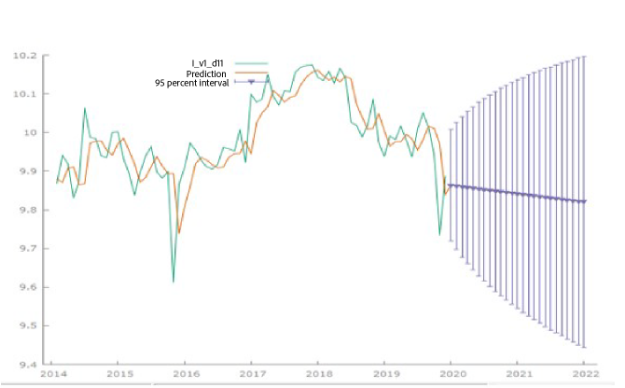
Source: authors’ calculations based on data from INE
Scenarios
We assessed three hypothetical scenarios, from the most pessimistic (actual) to the most optimistic scenario, in order to evaluate the impact of the application of economic incentives in airports of eight Latin American countries: Argentina, Colombia, Peru, Ecuador, Uruguay, Paraguay, Honduras, and Bolivia. The investigation centered on the airport most representative of each country and assumed a specific type of aircraft (Airbus A320).
The first scenario assumes the current situation of the airports continues, and uses information published in the official newspapers of each country to collect data. Table 3 presents the current costs per person in the airports of each country. Table 3 shows that Bolivia and Ecuador have the highest airport costs in Latin America, in eighth and seventh place, respectively.
Table 3: Costs per passenger in Latin American airports (in US dollars)
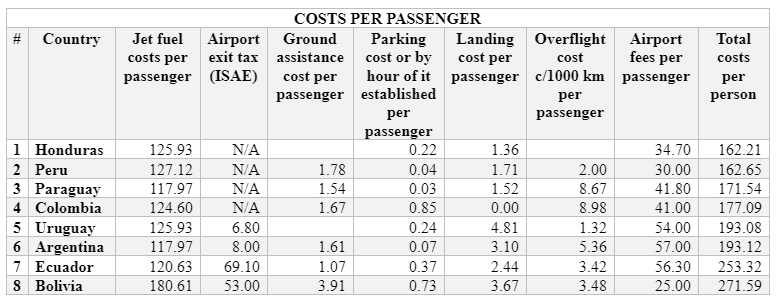
Source: authors’ calculations based on data published by newspapers of each country.
The second scenario assumes that Bolivia uses economic incentives to lower costs in its airports, and there is no change in the airports in the rest of Latin America. Table 4 presents this optimistic scenario, in which Bolivia rises to the fifth row after applying the economic incentives of a reduction of the airport exit tax (ISAE), the airport fees, and the jet fuel cost of El Alto International Airport.
Table 4: Costs per passenger in Latin American airports, with cost reductions to El Alto International Airport (in US dollars)
Source: authors’ calculations based on data provided by the newspaper of each country
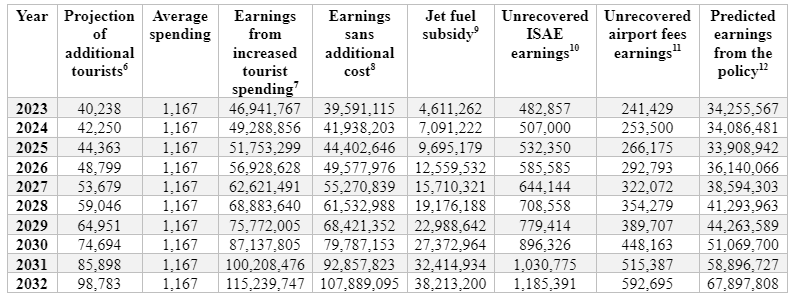
Table 5, the third scenario, shows the implications of the optimistic scenario for tax revenues. The calculation of tax revenues assumes a baseline of 255,633 tourists[4] per year, and compares the tax reductions effect that results in a constant increase in tourists over ten years. We also assume that the average tourist stays in Bolivia for 19 days, and spends an average of 61.4 dollars[5] per day, generating an average tourist spending of 1,167 dollars per tourist (SIET, 2014).
It is important to emphasize that this analysis does not include indirect earnings, such as the creation of jobs, the rent earnings from new airport facilities, or in the higher airport taxes from additional passengers. Therefore, the increase in the government’s tax revenues will likely be higher than the prediction shown in Table 5.
Table 5: Estimated tax revenues from the reduction in airport tax rates (in US dollars)
Source: authors’ calculations
Conclusion and recommendations
This study shows the huge potential of Bolivia’s commercial airline sector. In agreement with the data provided by INE, the number of tourists that entered Bolivia by El Alto International Airport in 2019 was 255,633 people, which means that the airport had 43 thousand less passengers compared to 2017. To recover that level, we must implement public policies which lower the costs of air travel in Bolivia.
To this end, we recommend the government and corresponding institutions to apply a strategy of economic incentives for the aero-commercial sector. This will not just benefit airlines and passengers, it will also generate spillover effects that will benefit more sectors. It is important to emphasize that the aero-commercial sector is the primary entrance for tourists into Bolivia, so it is essential to offer the best conditions possible to airlines, in order to open new routes and connections to different destinations around the world.
It is essential to work on public policy that results in more competitive prices for flight tickets and new routes and connections, as they are fundamental to social and economic development in Bolivia. Moreover, working with distinct [actors] in order to drive a tourism strategy that promotes the most attractive destinations in Bolivia can achieve a positive impact on the economy and the growth of tourists in Bolivia.
[1] Annual traffic including national and international passengers (INE, 2020).
[2] Second largest airport in Bolivia (by number of passengers).
[3] Number of international passengers.
[4] The number of passengers (255,633) is based on the number of international passengers during 2019. The third scenario assumes that the number of international passengers in 2019 stays constant (INE, 2020).
[5] The 61.4 dollars corresponds to the average daily spending of independent tourists, which is the most common type of tourist in Bolivia, now that the withdrawal of international airlines makes it more difficult and costly for a travel agency to organize a tour package or itinerary.
[6] This column shows the projection of additional numbers of tourists that is hoped for in the next ten years. For it, we considered an increase of 5% during the first three years, which we consider a conservative percentage, since in this period we will be applying strategies to attract airlines. For the following four years, we projected an increase of 10% according to the model. Finally, for the last three years, we estimate an increase of 15%, assuming that we will have perfected the model.
[7] We calculate the earnings of increased tourism, multiplying the projection of additional tourists by average spending.
[8] We work under the assumption that the number of passengers in 2019 is constant in subsequent years and that tax revenues decline by 7,350,653 USD reduction due to the consistent application of economic incentives.
[9] Based on a projection of additional tourists, we calculated an increase in the amount of flights and liters of jet fuel that will be necessary. Based on this we constructed the amount of jet fuel subsidies, which gives us the total cost that is assumed for the jet fuel policy.
[10] We calculated the cost which would imply the application of the ISAE policy based on the projection of additional tourists.
[11] We calculated the cost which would imply the application of the Airport Rate policy based on the projection of additional tourists.
[12] We calculate the predicted earnings after subtracting the subsidies and the unrecovered earnings.
Bibliography
Banco Mundial. (s.f.). Indicador de pasajeros de transporte aéreo, pasajeros transportados [Datos de serie temporal]. Recuperado de https://datos.bancomundial.org/indicador/IS.AIR.PSGR?end=2020&locations=PY-AR-PE-CO-UY-EC-BO-CL-BR&start=2008
Notife. (2019, mayo 6). Lanzan un plan de incentivos para retener a las aerolíneas en Rosario. Recuperado de https://notife.com/670195-lanzan-un-plan-de-incentivos-para-retener-a-las-aerolineas-en-rosario/
Resolución Nro. DGAC-YA-2019-0005-R. Instructivo para la implementación del Plan de incentivos en los aeropuertos administrados por la Dirección General de Aviación Civil. (22 de enero de 2019). Recuperado de https://www.aviacioncivil.gob.ec/wp-content/uploads/downloads/2019/09/RESOLUCION-DGAC-YA-2019-0005-R-1.pdf
Instituto Nacional de Estadística de Bolivia. (s.f.). Estadísticas de flujo de viajeros: Cuadros estadísticos [Sitio web]. Recuperado de https://www.ine.gob.bo/index.php/estadisticas-economicas/turismo/estadisticas-de-flujo-de-viajeros-cuadros-estadisticos/
NL Arenas. (2018, agosto). Nuevos incentivos para aeropuertos administrados por la DGAC. Recuperado de https://www.nlarenas.com/2018/08/nuevos-incentivos-para-aeropuertos-administrados-por-la-dgac/
Brigard Urritia. (s.f.). Nuevos incentivos tributarios para la industria de transporte aéreo. Recuperado de https://bu.com.co/es/insights/noticias/nuevos-incentivos-tributarios-para-la-industria-de-transporte-aereo
FEDESARROLLO. (2016). Competitividad en el transporte aéreo en Colombia. Recuperado de https://www.repository.fedesarrollo.org.co/bitstream/handle/11445/3280/Repor_Junio_2016_Martinez_y_Garcia.pdf?sequence=2&isAllowed=y
Sistema de Información Estadísticas de Turismo (SIET). (2014). Encuesta de Gasto de Turismo Receptor y Emisor – 2014.