
 Español
May 15th, 2019
In this article, we show how energy consumption data can be used to obtain information about the business dynamism in the country. Typically, one would use information from Fundempresa (1) to understand what is going on with the business sector, but Fundempresa only includes the most formal enterprises, which comprise a low percentage of the total (2), and the data is only available at the departmental level.
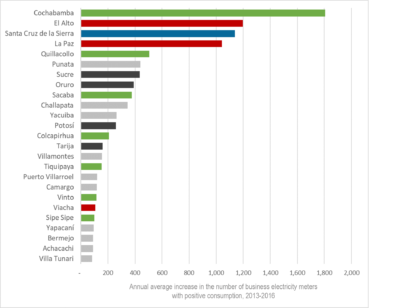
There are several ways to evaluate business dynamism through energy-consumption micro-data. The simplest way, and the equivalent of what we have shown in an article about population dynamics, is to identify where the largest number of electricity meters are being installed under the business category, that also have positive electricity consumption (suggesting active companies). Figure 1 shows the 25 municipalities that have added the largest number of business electricity meters (with positive electricity consumption) between 2013 and 2016.
The municipality of Cochabamba stands out in Figure 1, with an average annual increase of 1,800 business meters between 2013 and 2016. Even more impressive is that the other six municipalities, that are part of the metropolitan area of Cochabamba, are also included in this list (in green), which means that the metropolitan area of Cochabamba in total is increasing about 3,300 new business meters annually (net), suggesting a very important business dynamism.
The metropolitan area of La Paz (in red), led by El Alto, increased an average of 2,350 business meters per year during the period between 2013-2016. In the Santa Cruz metropolitan area, only Santa Cruz de la Sierra reached the list of the 25 municipalities with the highest increase in the number of business meters, with an average of 1,100 per year.
Figure 1: The 25 municipalities with the highest increases in the number of business electricity meters with positive consumption, 2013-2016
 Source: Andersen, Branisa & Calderon (2019)
The size of the company behind each business meter can vary between regions, so it is also interesting to see the increase in the amount of electricity consumption of companies in each municipality.
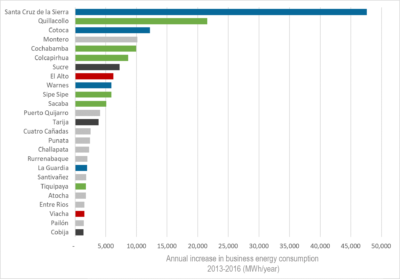
Figure 2 shows the 25 municipalities with the highest increase in business electricity consumption. There are important differences in comparison to Figure 1. In particular, the metropolitan area of Santa Cruz proves to be the most important, with an average annual increase in business electricity consumption of 70 GWh.
From this perspective, the metropolitan area of Cochabamba falls into second place, increasing approximately 53 GWh annually. And the Metropolitan area of La Paz proves to grow much slower, with an increase of only 8 GWh per year.
Important intermediate municipalities that stand out in Figure 2, are: Montero, Puerto Quijarro, Cuatro Cañadas, Punata, Challapata, Rurrenabaque, Santivañez, Atocha, Entre Ríos (Cochabamba), and Pailón.
Figure 2: The 25 municipalities with the highest increase in the consumption of electricity in the business category (excluding mining), 2013-2016
 Source: Andersen, Branisa & Calderón (2019)
Electricity-using companies mainly belong to the tertiary sector (services and trade) in urban areas, while agricultural oriented companies and the transport sector tend to use diesel as its main source of energy.
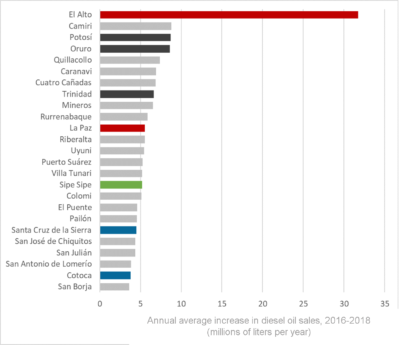
Figure 3 shows the 25 municipalities with the largest increases in the expenditure of diesel oil between 2016 and 2018. The city of El Alto stands out with an increase of more than 30 million liters per year; almost four times greater than the second municipality (Camiri). The metropolitan area of Cochabamba almost does not register on this list (only the municipality of Sipe Sipe). Intermediate municipalities are much more prominent on this list. From higher to lower increase in diesel oil sales, we observe the following municipalities: Camiri, Quillacollo, Caranavi, Cuatro Cañadas, Mineros, Rurrenabaque, Riberalta, Uyuni, Puerto Suarez, Villa Tunari, Colomi, El Puente (Santa Cruz), Pailón, San José de Chiquitos, San Julián, San Antonio de Lomerío, y San Borja.
Figure 3: The 25 municipalities with the highest increases in diesel oil sales between 2016 and 2018
 Source: Andersen, Branisa & Calderón (2019), based on data provided by ANH.
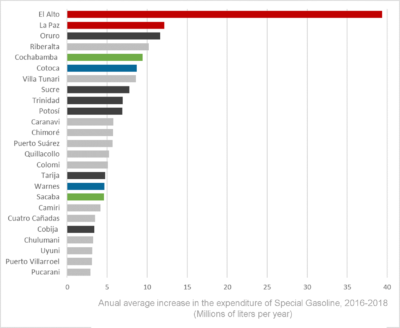
The consumption of gasoline is not as closely related to business activities because it is mainly used to fuel private cars. However, municipalities where car ownership is increasing rapidly, probably suggests the presence of successful entrepreneurs and employees.
Figure 4 again highlights the huge increase in the sales of fuels in El Alto. On average, between 2016 and 2018 the sales of gasoline increased by 39 million liters per year.
Figure 4: The 25 municipalities with the highest increases in the sales of gasoline between 2016 and 2018
 Source:
Source: Andersen, Branisa & Calderón (2019), based on data provided by ANH.
The preceding four figures illustrate different types of business dynamics in different parts of the country, and it is difficult to summarize. However, El Alto is indisputably the municipality with most business dynamism in Bolivia, as it appears in all four figures, and if not first, it is at least in a very high position. The only other municipality that appears in all four figures is Quillacollo, which is located in the metropolitan area of Cochabamba.
Table 1 shows the 53 municipalities that appear at least once in Figures 1 to 4, with the most dynamic ones listed first in each category. Figure 5 shows the location of the same 53 municipalities on a map.
Table 1: The 53 municipalities with most business dynamism in Bolivia, 2013-2018
(the municipalities that appear at least once in the previous four figures)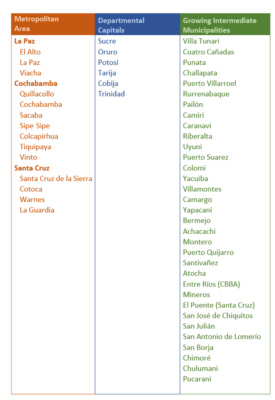
Source: Andersen, Branisa & Calderón (2019)
Figure 5: Map of the 53 municipalities with the highest business dynamism in Bolivia, 2013-2018 (the municipalities appearing at least once in the previous four figures).
 Source: Andersen, Branisa & Calderón, Map by Lily Peñaranda
Some preliminary conclusions that arise from this data:
- The metropolitan area of Cochabamba seems particularly successful in encouraging small enterprises in the service sector.
- The transport sector in El Alto is increasing extremely rapidly, which has interesting implications that require more research.
- There are many different centres of economic activity in Bolivia, and this information can serve as basis for a more informed territorial development policy.
Notes:
(1) Fundempresa is the institution where all privately owned companies ought to register in Bolivia.
(2) Bolivia ranked second, after Georgia, in the IMF’s global shadow economy ranking (158 countries) that took into account data between 1991 and 2015. Bolivia’s average informal economic activity is as high as 62.28% according to the Working Paper published in 2018.
—-
* Lykke E. Andersen, Ph.D., Executive Director OF SDSN Bolivia.
** Guillermo Guzmán, Ph.D., Centro de Investigaciones Sociales (CIS) de la Vicepresidencia del Estado.
The viewpoints expressed in the blog are the responsibility of the authors and do not necessarily reflect the position of their institutions. These posts are part of the project “Atlas of the SDGs in Bolivia at the municipal level” that is currently carried out by the Sustainable Development Solutions Network (SDSN) in Bolivia, of which CIS is a member.