
 Español
The world is widely believed to be in the midst of the sixths mass extinction event, this time caused by humans rather than meteors or volcanic eruptions. A recent study by WWF estimates that vertebrate abundance in the world has decreased by about 60% since 1970. The main drivers of biodiversity loss around the world are over-exploitation of species (e.g. hunting and fishing) and habitat loss due to land use change (e.g. deforestation).
One of the most important goals of SDG 15: Life on Land is to stop further biodiversity loss, so for our upcoming Municipal Atlas of the SDGs in Bolivia, we need an indicator reflecting biodiversity loss in each municipality. In this blog, we will present what we think is the best possible indicator that can be calculated with the data available.
Our proposal is based on the following key assumptions:
- Biodiversity loss in Bolivia is mainly driven by habitat loss. While some particularly attractive or tasty species are being over-hunted/fished, this effect is dwarfed by the billions of animals and plants that get obliterated when Bolivian forests are converted to agricultural land at a rate of several hundred thousand hectares per year.
- Habitat loss in areas with high species diversity is worse for biodiversity than habitat loss in areas with lower species diversity. Thus, deforestation in areas with thousands of different species is given more weight in our species disturbance indicator than deforestation in areas with few different species.
- All species are given equal weight. The indicator we develop below gives equal weight to all species, irrespective of their cuteness, their economic value, or how threatened they are.
Given those three key assumptions, we can calculate an Index of Species Disturbance (ISD) at the municipal level by overlapping a map of deforestation at very high resolution (1) with a map of Species Richness (2).
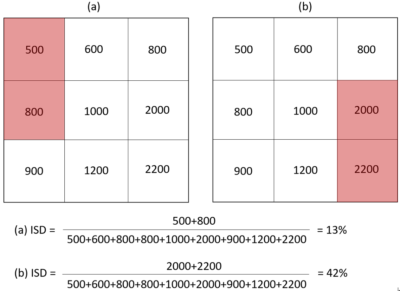
The basic idea behind the ISD indicator is illustrated conceptually in Figure 1 below, which provides a couple of numerical examples to illustrate how the indicator is calculated. Although each municipality in the real calculations contains hundreds of thousands of pixels, in our simple numerical example we have included only 9 pixels. The number written in each pixel indicates the level of Species Richness, and it can vary between 0 and 2825. It indicates how many species can naturally live in the area out of a group of several thousand taxa indicator species (according to a 2005 study by FAN, referenced in footnote 2).
Figure 1 contains two examples: (a) and (b). In both examples, 2 out of 9 pixels have been deforested (indicated in red), meaning that the deforestation rate in both examples is 22%. However, in panel (a) deforestation took place in areas with relatively low Species Richness, while in panel (b) it took place in areas with high Species Richness, leading to very different numbers for the Index of Species Disturbance (ISD): 13% in case (a) and 42% in case (b).
Figure 1: Conceptualization of the Index of Species Disturbance (ISD)
 Source: Authors’ calculations
The index is simple to calculate (using ArcGIS) and simple to interpret. If the deforestation rate is zero, the ISD is also 0% and if the deforestation rate is 100%, the ISD is also 100%. If deforestation takes place in a place with average species richness, the ISD coincides with the deforestation rate, but if deforestation takes place in areas of high species richness the ISD will be higher than the deforestation rate, and vice versa.
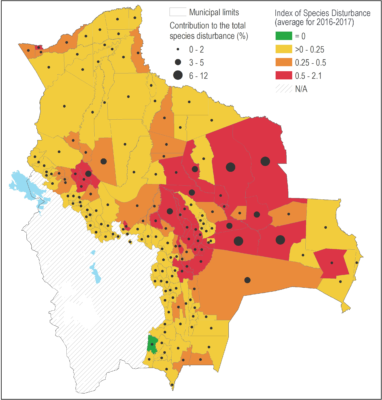
At the national level the average annual Index of Species Disturbance during 2016 and 2017 was 0.36% per year. The municipality with the highest ISD in 2016-2017 was Pailón at 2.12% per year. This was followed by La Guardia with an ISD of 2.08% per year, and Cuatro Cañadas with 1.76%. Map 1 shows that, in general, the highest ISD values are found in the department of Santa Cruz, where deforestation is also concentrated.
In absolute terms, the biggest disturbance of species is taking place in just a dozen municipalities, which were responsible for more than half of the disturbance of species in Bolivia in 2016 and 2017. Ten of these municipalities are located in the department of Santa Cruz, one in Beni, and one in La Paz.
Map 1: Average Index of Species Disturbance in Bolivia, 2016 – 2017, and contribution to the total species disturbance, by municipality
 Source: Authors’ calculations.
Note: Only municipalities with more than 0.1 km2 of forest in 2015 were included in the analysis.
While no single indicator of biodiversity loss is perfect, we believe the one shown in Map 1 reflects well the different levels of pressure on biodiversity caused by deforestation across Bolivian municipalities.
Footnotes:
(1) Deforestation data is calculated for 2016 and 2017 from the Hansen Global Forest Change data set version 1.5. https://earthenginepartners.appspot.com/science-2013-global-forest/download_v1.5.html). The pixels are of approximately 27.2 x 27.2 meters, implying that the whole country is covered by almost 1.5 billion pixels. Calculations have been made for each of these 1.5 billion pixels and have subsequently been aggregated to the municipal level.
(1) Riqueza Absoluta de Especies de FAN (Fundación Amigos de la Naturaleza) (2005) Visión de conservación de la biodiversidad en el corredor Amboró-Madidi. Santa Cruz de la Sierra, Bolivia: Fundación Amigos de la Naturaleza.
———————————-
* Lykke E. Andersen, Ph.D., Executive Director, Sustainable Development Solutions Network – Bolivia.
** Juan Carlos Ledezma, Scientific Manager, Conservation International – Bolivia.
The Sustainable Development Solutions Network (SDSN) in Bolivia is currently preparing a Municipal Atlas of the SDGs in Bolivia. It is a significant collaborative effort involving many different institutions. The viewpoints expressed in the blog are the responsibility of the authors and may not reflect the position of their institutions. Readers are encouraged to provide feedback in the comments below or directly to the overall coordinator of the Atlas, Dr. Lykke E. Andersen, Executive Director of SDSN Bolivia at Lykke.E.Andersen@sdsnbolivia.org.