
 Español
June 14th, 2019
It is difficult to find good information about SDG 16: Peace, justice and strong institutions at the municipal level in Bolivia. However, UDAPE recently published a very helpful Fiscal Atlas. Specifically, the indicator that measures Budget Execution helps us understand how each of the municipalities is doing with regard to goal 16.6: Develop effective, accountable and transparent institutions at all levels. Municipalities with low Budget Execution capabilities are clearly not operating at their best, given that not even the low annual budget assigned to them by their Annual Operating Plan (POA) is fully spent/invested. This suggests a lack of management capabilities at the local level, which will probably hinder their capacity to achieve the Sustainable Development Goals.
Graph 1 shows Budget Execution (% of the annual assigned budget for 2017, that was spent/invested) for a selection of municipalities (the 28 municipalities with more than 50 thousand inhabitants and the 15 municipalities with under 2 thousand inhabitants in 2017). The simple average for all municipalities in Bolivia reaches 70.7%, signifying that municipalities have executed available financial resources up to September, leaving funds for the remaining months of the year in the National Treasury (TGN).
The same graph shows the amplitude of capacities among a variety of municipalities. The best performing municipality executed 94% of the budget, but the worst performing only 15%. In general, municipalities with larger populations tend to have a better Budget Execution capability, while municipalities with low Budget Execution capabilities all have small populations. In 2017, Puerto Siles, with less than 1000 inhabitants, executed only 15% of its annual assigned budget, not even reaching the end of February in terms of annual expenditure. Trinidad, on the other hand, spent its assigned budget for the year up to early December in 2017. The two municipalities represent the extremes, but the variability in the effective use of financial resources between the remaining 337 municipalities is very high.
Graph 1. Budget Execution of municipalities with more than 50,000 inhabitants and municipalities with less than 2,000 inhabitants, 2017

Source: Own elaboration based on data from the Fiscal Atlas of UDAPE.
Table 1 shows a clear relation between population size and execution capability. Municipalities with populations equal to or larger than 250,000, reach a Budget Execution average of 86.2%. Municipalities with populations ranging between 20,000 and 250,000 inhabitants, achieve an average of 76.2%. However, most municipalities have between 2,000 and 20,000 inhabitants and their Budget Execution capability average is very close to the total average of 70%. Very small municipalities with less than 2,000 inhabitants, on the other hand, have an execution capability average of only 51.7%. Despite these figures, there are small municipalities with high execution capabilities and larger municipalities that show a capacity lower than the total average. This is the case for Huachacalla and Montero respectively (see Graph 1).
Table 1: Budget Execution, by municipal population size, 2017
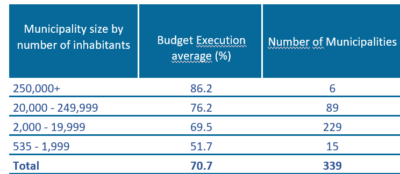
Source: Own elaboration based on data from the Fiscal Atlas of UDAPE.
Graph 2 shows a negative relationship between Budget Execution and Extreme Energy Poverty (1). The correlation is not strong (ρ = -0.31), but it probably reflects a vicious cycle between poverty and local management capabilities.
Graph 2. Extreme Energy Poverty (2016) and Budget Execution (2017)
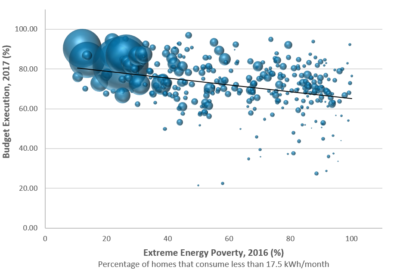 Source: Own elaboration based on Atlas Fiscal de UDAPE data; and Andersen, Branisa & Calderón (2019).
It is also evident from the size of the bubbles that all municipalities with low Budget Execution capabilities are small and very poor. For those reasons, young people tend to leave these municipalities, which therefore tend to become even smaller over time.
Notes
(1) A previous article describes how Extreme Energy Poverty is measured
* Lykke E. Andersen, Ph.D., Executive Director, SDSN Bolivia.
** Lily Peñaranda, M.Sc., Chief Development Manager, SDSN Bolivia.
The viewpoints expressed in the blog are the responsibility of the authors and do not necessarily reflect the position of their institutions. These posts are part of the project “Municipal Atlas of the SDGs in Bolivia” that is currently carried out by the Sustainable Development Solutions Network (SDSN) in Bolivia.