
 Español
October 15th, 2019
While the icon for SDG 5 says “Gender Equality”, the full text of the goal on the United Nations Sustainable Development Goal site is actually “Goal 5: Achieve gender equality and empower all women and girls.” This means that the gender equality goal is inherently biased towards women from the outset. This would be fine if women were overwhelmingly disadvantaged in all areas of life everywhere.
However, in this blog we will show that this is not necessarily so, and that decisions will have to be made on what we consider gender equality for the purpose of the upcoming Municipal Atlas of the SDGs in Bolivia.
For example, concerning the most basic question of having a roof over your head and a place to call home, we know from the latest population census in Bolivia (2012), that men are almost twice as likely to be homeless as women. In Santa Cruz de la Sierra, the municipality with most homeless people in Bolivia, men are almost 5 times more likely to be homeless than women, while in El Alto, the municipality with the second largest number of homeless people, men and women are almost equally likely to be homeless.
What is arguably worse than being homeless? Being incarcerated. In Bolivia men are about 10 times more likely to be incarcerated than women[1].
What is arguably worse than being incarcerated? Being so desperate that you prefer to kill yourself rather than to continue living in this world. Male suicide rates in Bolivia are almost 3 times higher than female suicide rates[2].
What is arguably worse than killing yourself? Being killed by somebody else against your will. According to police records in Bolivia, men are about 4 times more likely to be murdered than women.
Being homeless, incarcerated, suicidal, or murdered are all extremely bad situations, but fortunately they are rare in Bolivia.
How about gender equality in more everyday situations, such as going to school or being healthy?
Gender parity in school attendance is a widely used gender equality indicator, and it can easily be calculated at the municipal level in Bolivia as well. According to data from the Ministry of Education in Bolivia, there are about 95 girls in school for every 100 boys, so there is a slight under-representation of girls, but that may be at least partly explained by the better performance of girls in school. Boys are more than twice as likely to fail a school year and having to repeat. In 2017, 50,671 boys failed a school year, whereas this was only the case for 23,428 girls. The same year, 58,834 boys were repeating a school year, while this was the case for only 29,417 girls. By the end of undergraduate studies, women dominate graduating classes and are substantially over-represented among those graduating with honours.
It is well-known that women are healthier and live longer than men almost everywhere, and Bolivia is no exception. Unfortunately, we do not have gender disaggregated data at the municipal level on life expectancy. Indeed, the only gender-disaggregated health indicator which we have available at the municipal level is HIV incidence. Using data provided by the Programa Nacional ITS/VIH/SIDA y Hepatitis Virales, we found that men are twice as likely as women to contract HIV.
Work is where women seem to be at a systematic disadvantage. According to data from the latest population census (2012), the labour market participation rate is lower for women than for men in almost every Bolivian municipality, and earnings data from household surveys systematically show that women earn less than men per hour worked, even with the same levels of education.
Analysis of potential gender equality indicators
The SDG Index methodology that our Municipal Atlas of the SDGs in Bolivia uses requires that there is a clear unidirectional goal. This means that gender parity cannot be approached from both sides, but has to be defined so that once women are at least as well of as men, then the gender equality goal is achieved and the municipality will turn green for that indicator.
Below we are showing gender parity maps for all the indicators for which we managed to obtain gender disaggregated data at the municipal level. They are all constructed so that if the value is less than one, then women are at a disadvantage compared to men, whereas if it is larger than 1, then women are better off than men. Municipalities where women are equal or better off than men are painted green, whereas municipalities where women are substantially worse off than men are painted red. This is an unusually long blog post, as we have a lot of data to present and discuss.
School attendance
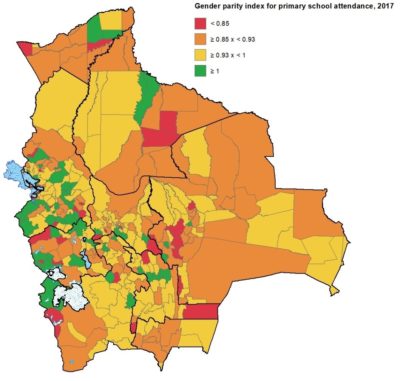
Figure 1 shows the gender parity index for primary school attendance in 2017. It is measured as the number of girls enrolled in primary school divided by the number of boys enrolled in primary school in each municipality. It would have been better to use the gender parity index for primary net enrolment rates, but unfortunately we do not have reliable estimates of the total number of primary school aged boys and girls in each municipality, so the rates cannot be estimated with sufficient precision. The gender parity index for school attendance is a good proxy, if the number of boys and girls in the municipality is approximately equal. At primary school level that seems to be a reasonable assumption, at least for municipalities with many children.
Figure 1: Gender parity index for primary school attendance, 2017
 Source: Ministerio de Educación: Sistema de Estadísticas e Indicadores Educativos
(http://seie.minedu.gob.bo/).
At the national level, the gender parity index for primary school attendance is 0.94, so there are about 6% fewer girls in primary school than boys. However, the values do not seem to have anything to do with poverty, rurality, or any other possible explanatory factor we can think of. Indeed, the poorest municipalities in the Bolivian highlands seem to have slightly better gender parity indices. We suspect that most of the variation in Figure 1 is random. For example, the two municipalities with the lowest index (Esmeralda with 0.5) and the highest index (Cruz de Machacamarca with 1.75) are neighbours within the same province in Oruro. The first has 6 girls and 12 boys enrolled in primary school, whereas the second has 7 girls and 4 boys enrolled. With so few children in each municipality, even these extreme values are well within random variation in the number of boys and girls present in the municipality.
In addition, the fewer girls in primary school at the national level is not necessarily due to girls not getting into primary school or not staying in primary school, but may rather be due to boys being 50% more likely to repeat a year of primary school (see further below). Thus, there may simply be more boys in primary school because they are more likely to repeat a school year.
Given the above two arguments, we conclude that it is not worth including this indicator among the SDG5 indicators in our Municipal Atlas of the SDGs in Bolivia. The indicator provides hardly any reliable information about where to target interventions to ensure that all girls complete primary school.
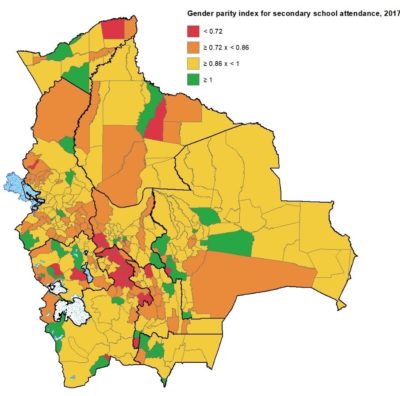
Figure 2 shows the same indicator, but at secondary school level. At this level there seem to be a bit more real information and a bit less random noise in the indicator. At least the gender parity index of secondary school attendance is negatively related with poverty, suggesting that girls are more disadvantaged in poorer municipalities, as would be expected. In the map we see a red cluster in northern Potosí, which is an area of extremely high poverty.
However, there are other important problems with this indicator. First, the gender differences in repetition rates are even higher at the secondary school level, with boys being 137% more likely to repeat a school year than girls. Thus, a gender parity value below 1 does not necessarily reflect that girls are more likely to drop out of secondary school than boys, but rather that boys have to repeat school years more often than girls (see further below). Second, when the gender parity index is above 1, the municipalities are coloured green, and are considered to have achieved the goal of gender equality. But in reality, rather than reflecting a happy outcome of gender equality, this situation may instead reflect young men dropping out of school early in order to work, especially in mining, construction or agriculture, which demands low-skilled, but strong workers. On average, the drop-out rates for boys are about 60% higher than the drop-out rates for girls at the secondary school level (see further below).
Given the abovementioned problems, we do not recommend this indicator for inclusion in the Municipal Atlas either.
Figure 2: Gender parity index for secondary school attendance, 2017
Source: Ministerio de Educación: Sistema de Estadísticas e Indicadores Educativos
(http://seie.minedu.gob.bo/).
Drop-out rates
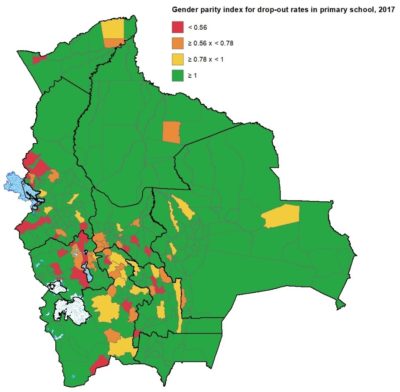
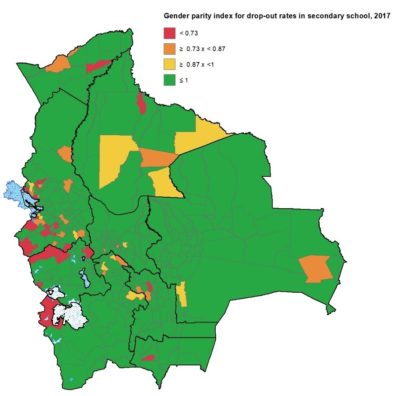
Figures 3 and 4 show the gender parity indices for drop-out rates in primary and secondary school, respectively. Drop-out rates are calculated from individual level administrative data and are therefore both precise and up-to-date. Both maps are overwhelmingly green, indicating that girls are less likely to drop out of school than boys in the vast majority of municipalities. Municipalities where girls are more likely to drop out than boys stand out clearly, and can therefore be the subject of targeted interventions.
Figure 3: Gender parity index for drop-out rates in primary school, 2017
 Source: Ministerio de Educación: Sistema de Estadísticas e Indicadores Educativos
(http://seie.minedu.gob.bo/).
The correlation between gender parity in drop-out rates at primary and secondary levels is low (r = 0.07), which means that there may be different underlying causes. It is therefore difficult to choose between the two. However, since drop-out rates generally are very low at primary school level, we think that the gender parity index for drop-out rates in secondary school is the best choice, and recommend that it is included among one of the SDG5 indicators for the Municipal Atlas.
Figure 4: Gender parity index for drop-out rates in secondary school, 2017
 Source: Ministerio de Educación: Sistema de Estadísticas e Indicadores Educativos
(http://seie.minedu.gob.bo/).
Repetition rates
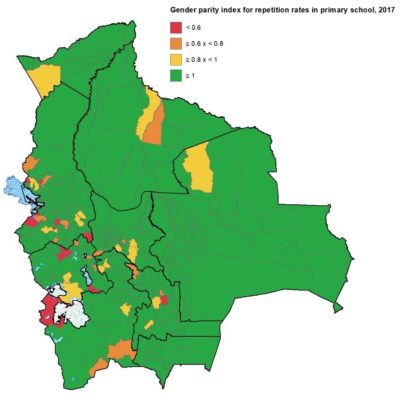
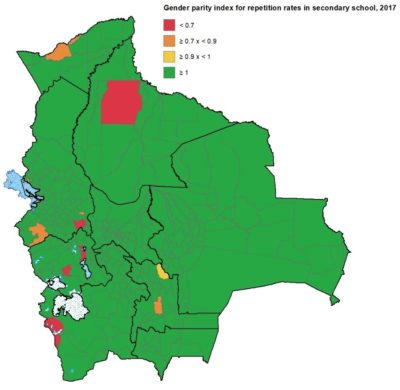
Figures 5 and 6 show the gender parity indices for repetition rates in primary and secondary school, respectively. Repetition rates are also calculated from individual level administrative data and are therefore both precise and up-to-date. Both maps are overwhelmingly green, indicating that girls are less likely to repeat a school year than boys in the vast majority of municipalities, especially at the secondary level. Indeed, at the secondary level, there are only 13 municipalities out of 339 with a parity index in repetition rates below 1.
Figure 5: Gender parity index for repetition rates in primary school, 2017
 Source: Ministerio de Educación: Sistema de Estadísticas e Indicadores Educativos
(http://seie.minedu.gob.bo/).
Figure 6: Gender parity index for repetition rates in secondary school, 2017
 Source: Ministerio de Educación: Sistema de Estadísticas e Indicadores Educativos
(http://seie.minedu.gob.bo/).
Given that boys in Bolivia are almost everywhere more likely than girls to fail a school year, and thus either having to repeat the year or drop out of school, it makes little sense to have a goal of empowering women and girls in the Bolivian education system. Boys are clearly struggling more than girls, and attention should rather focus on how to reduce the systematically higher failure rates of boys. We therefore recommend not to include the two gender parity indices of repetition rates in the Municipal Atlas.
Students with disabilities
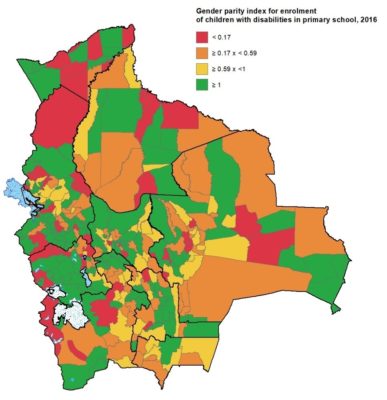
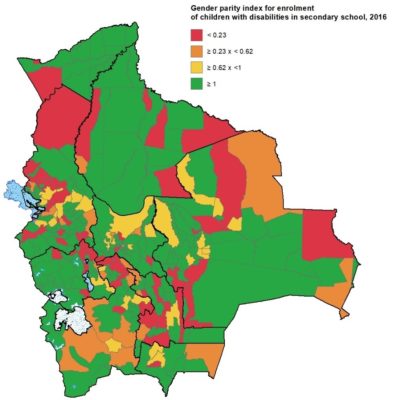
Figures 7 and 8 show the gender parity index for enrolment of children with disabilities in the regular school system, at the primary and secondary level, respectively. At the national level this parity index is 0.71 at the primary level and 0.80 at the secondary level, indicating 20 – 29% less handicapped girls enrolled in the regular school system. This may suggest that girls with disabilities are facing more obstacles to getting into school, although there may be alternative explanations as well. For example, girls may be more likely to be enrolled in special schools for children with disabilities, but the Ministry of Education do not report statistics from these schools.
Figure 7: Gender parity index for enrolment of children with disabilities in primary school, 2016
 Source: Ministerio de Educación: Sistema de Estadísticas e Indicadores Educativos
(http://seie.minedu.gob.bo/).
The main problem with these two indicators is that in most municipalities there are few children with disabilities at all, so just random variation in the gender of the children with handicaps can make this indicator fluctuate wildly. Consider two neighbouring municipalities in Chuquisaca: Sopachuy had 1 boy and 2 girls with disabilities enrolled in primary school in 2016, resulting in a parity index of 2.0. In contrast, Villa Alcalá had 2 boys and 1 girl with disabilities, resulting in a parity index of 0.5. The first is coloured green, while the second is coloured orange, but clearly the differences could easily be explained by random variation.
Figure 8: Gender parity index for enrolment of children with disabilities in secondary school, 2016
 Source: Ministerio de Educación: Sistema de Estadísticas e Indicadores Educativos
(http://seie.minedu.gob.bo/).
These indicators only make sense in populous municipalities with a large number of children with disabilities. In Santa Cruz de la Sierra, for example, there are 171 boys and 94 girls with disabilities enrolled in regular primary schools, resulting in a parity index of 0.55. At the secondary school level there are 127 boys and 83 girls enrolled, resulting in a parity index of. 0.65. These results suggest that girls with disabilities face much bigger obstacles than boys with disabilities in the regular education system in that municipality. But about half of all students with disabilities are enrolled in special schools, and these might favour girls.
Given both the high level of random noise in the data, and the lack of information from all the specialized schools for children with disabilities, we conclude that these two indicators do not contribute sufficient information to be include in the Municipal Atlas of the SDGs in Bolivia.
Literacy rates
Figure 9 shows the gender parity index for adult literacy rates, according to the 2012 population census. Women are almost everywhere less likely to know how to read and write than men, and the gender differences are particularly large in certain areas in, and close to, northern Potosí.
This is a historical problem, and the country has been systematically battling adult literacy education during the last several decades. The remaining illiterate groups consist mainly of women aged 60 or more.
The information for this indicator is quite old, and may have improved substantially since 2012. Indeed, UNESCO officially declared Bolivia free of illiteracy already in 2008, when more than 96% of the population achieved literacy[3]. Thus, literacy seem to be too easy a target to be included in the Municipal Atlas of the SDGs in Bolivia, and we recommend not including the gender parity index for adult literacy rates either, but rather some harder education related parity indices.
Figure 9: Gender parity index for adult literacy rates, 2012
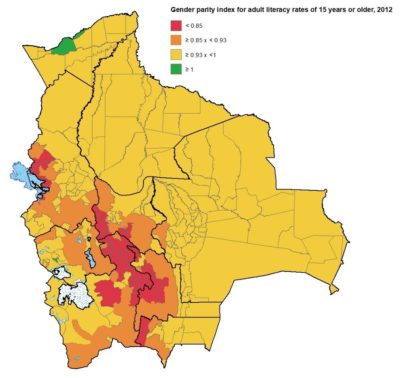 Source: Censo Nacional de Población y Vivienda, 2012.
Education of adult population
A more relevant gender parity index in the area of adult education levels is the ratio of the average number of years of study for women compared to years of study of men in each municipality.
Figure 10 shows that women have lower education levels almost everywhere in Bolivia, except for a few municipalities in the department of Santa Cruz. This is also a historical problem, and one that is more difficult to remedy than adult illiteracy, as people who have been out of the formal education system for decades are unlikely to enter it again.
Figure 10: Gender parity index for years of education for adults, 2012
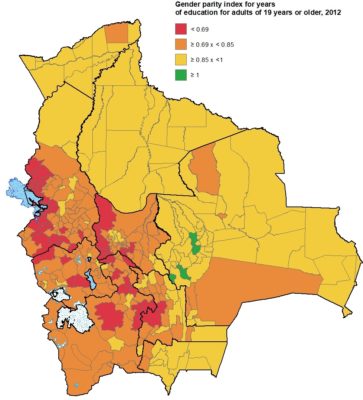 Source: Censo Nacional de Población y Vivienda, 2012.
A more relevant, and more policy sensitive, indicator would be the gender parity index for years of education of young people entering the labour market. Figure 11 shows the gender parity index for years of education for 25-35 year olds. It shows more gender equality than the previous indicator, and, importantly, it is an indicator that can change significantly before 2030, when a completely new generation will be in that age group. We recommend that this indicator is included among the SDG5 indicators in the Municipal Atlas of the SDGs in Bolivia.
Figure 11: Gender parity index for years of education for 25-35 Year Old’s, 2012
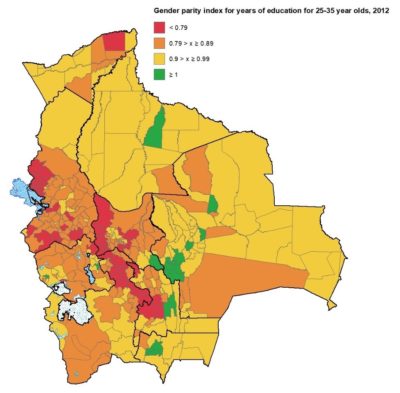 Source: Censo Nacional de Población y Vivienda, 2012.
Another relevant indicator that can be calculated from the population census is the gender parity index for English speaking rates in adults. This is calculated as the percentage of adult women who speak English divided by the percentage of adult men who speak English (or at least claim to speak English).
Figure 12: Gender parity index for English speaking rates in adults, 2012
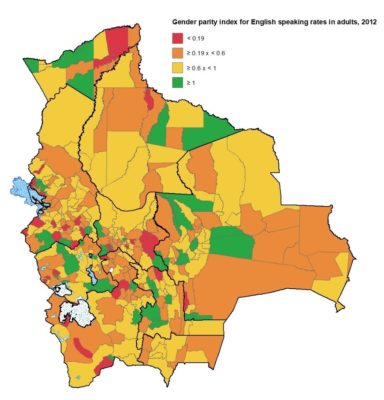 Source: Censo Nacional de Población y Vivienda, 2012.
Speaking English facilitates access to sophisticated information and participation in international processes, and it should be promoted for both men and women. However, it is particularly important to make sure that women are not left behind at these higher levels of participation, so we recommend including this indicator in the Municipal Atlas of the SDGs in Bolivia.
Labour market participation
The area where women are most systematically left behind is in labour market participation. Historically, many women have stayed at home in order to raise children and run the household. However, it is important to facilitate and encourage women’s participation in the labour market for several reasons. First, it contributes to higher economic growth of the country, although part of the higher growth is due to their work at home not being counted in GDP. Second, it empowers women to earn their own income, rather than having to always ask their partner or parents for money. Third, participating in the labour market creates more professional and social relations and interactions, which also helps empower women.
Figure 13: Gender parity index for labour market participation rates, 2012
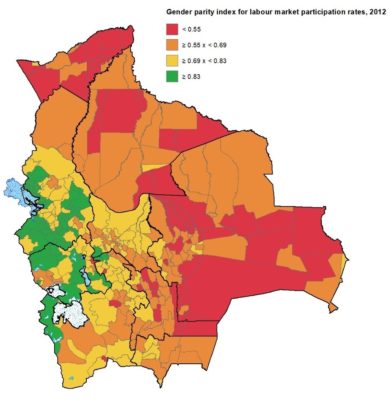 Source: Censo Nacional de Población y Vivienda, 2012.
Paradoxically, female labour market participation rates tend to be higher in poorer municipalities. Still, we think a key component of gender equality is to make sure that men and women are about equally likely to participate in the labour market, although a small difference should be accepted to allow women some time off for maternity. We recommend including this indicator in the Municipal Atlas of the SDGs in Bolivia, but rather than making perfect parity the goal, we think the goal should be the average of the five municipalities with the highest values, e.g. 0.95.
Health indicators
The only municipal level health indicators that we have obtained at a sex disaggregated level is HIV prevalence. Figure 14 shows the gender parity index for HIV incidence, averaging the years 2014 to 2017 in order to reduce random variation in this fortunately infrequent disease. Most municipalities are green, indicating that women are less likely to get infected by HIV. Indeed, at the national level, the parity index is 2.2, indicating that men are more than twice as likely to get HIV than women.
Figure 14: Gender parity index for HIV incidence, 2014-2017
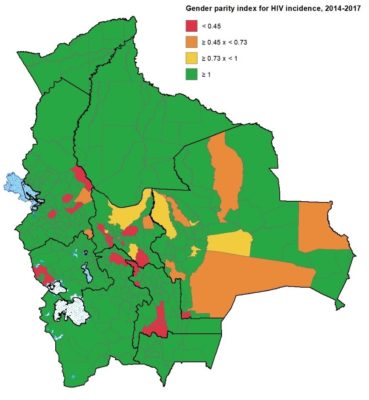 Source: Programa Nacional ITS/VIH/SIDA y Hepatitis Virales 2014-2017.
Most of the red municipalities on the map are caused by a single woman and zero men with HIV in each municipality, which is hardly a systemic problem.
One municipality that clearly stands out in the detailed data provided by the National STI/HIV/AIDS and Viral Hepatitis Program, is Puerto Villarroel in the Department of Cochabamba. Not only because it has one of the highest HIV incidences in the country and ranks 11th in terms of absolute numbers that measure new cases between 2014 and 2017; but because particularly girls have been hit the hardest. Girls aged 15 to 19 account for only 6.3% of new HIV cases in the rest of the country, but in Puerto Villarroel, they account for 45.1% of cases. This is clearly a case of very young girls who are dangerously exposed to life-threatening diseases, and in turn generating dangerous transmission hotspots.
This problem, and similar problems in other municipalities, require specific interventions. Unfortunately, the low number of cases recorded in some municipalities generates the same problem perceived in the case of the education of handicapped girls. Only one woman with HIV can paint the map red, when in fact it is not a significant problem. Thus, we suggest not to include this indicator in the Municipal Atlas of the SDGs in Bolivia.
Multidimensional poverty
We were able to calculate municipal level Multidimensional Poverty Indices separately for female and male headed households, using a methodology developed by INESAD at the request of, and in collaboration with, Swisscontact, for the project Inclusive Markets, financed by the Swedish Cooperation (ASDI) and the Swiss Cooperation (COSUDE) in 2017. The methodology includes 9 different indications of lack of voice, choice and resources:
- At least one illiterate person in the household
- At least one person aged 6+ without personal identification documents
- No telephone or cell phone in the household
- At least one child birth took place outside a health facility within the last 5 years
- At least one teenage pregnancy in the household within the last 5 years
- At least one child between 6 and 19 who is not studying
- No potable water on the property
- No electricity
- No basic sanitation services.
Figure 15: Gender parity index for Multidimensional Poverty, 2012 (measured by the gender of the head of household)
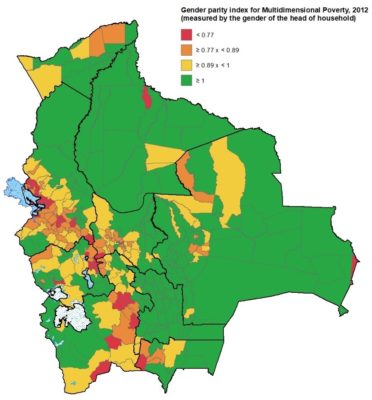 Source: Censo Nacional de Población y Vivienda, 2012.
Although the data is a bit old, from the 2012 Population Census, the calculations are very robust, and clearly point out the municipalities where female-headed households are much worse off than male-headed households. We recommend that this indicator is included in the Municipal Atlas of the SDGs in Bolivia.
Conclusions
Having analysed 15 different gender disaggregated indicators in detail, we conclude that the most useful ones for the Municipal Atlas of the SDGs in Bolivia are the following:
- The Gender Parity Index for Dropout Rates, 2017.
- The Gender Parity Index for Years of Education for 25-35 year olds, 2012.
- The Gender Parity Index for English-Speaking Adults, 2012
- The Gender Parity Index for Labor Market Participation Rates, 2012.
- The Gender Parity Index for Multidimensional Poverty, 2012 (measured by the gender of the head of the household).
[1] https://www.redalyc.org/jatsRepo/112/11244805004/html/index.html .
[2] https://ourworldindata.org/suicide .
[3] https://elpais.com/internacional/2008/12/21/actualidad/1229814001_850215.html
* Lykke E. Andersen, Ph.D., Executive Director OF SDSN Bolivia.
** Line Munk, SDSN Bolivia
The viewpoints expressed in the blog are the responsibility of the authors and do not necessarily reflect the position of their institutions. These posts are part of the project “Atlas of the SDGs in Bolivia at the municipal level” that is currently carried out by the Sustainable Development Solutions Network (SDSN) in Bolivia.