
 Español
February 9th, 2023
In last week’s blog we showed that there is a strong correlation between nightlight intensity (NTL) and human flourishing, and we used changes in NTL to understand which municipalities had shown the biggest advances between 2012 and 2021. The three metropolitan areas of Bolivia clearly stood out as the centers of human flourishing.
We also showed that there was a significant drop in both GDP and NTL in 2020, due to the COVID-19 pandemic (see Figure 1). The drop in NTL (4.0%) was not as large as the drop in GDP (8.7%), because a lot of the lights that can be seen from space are street lights, which were kept on even if people were not allowed to go out at night. In this blog we will disaggregate the 4% drop in NTL in 2020 by municipality to get an idea of which municipalities suffered most during the first year of the pandemic.
Figure 1: Evolution of total NTL and real GDP in Bolivia, 2012-2021
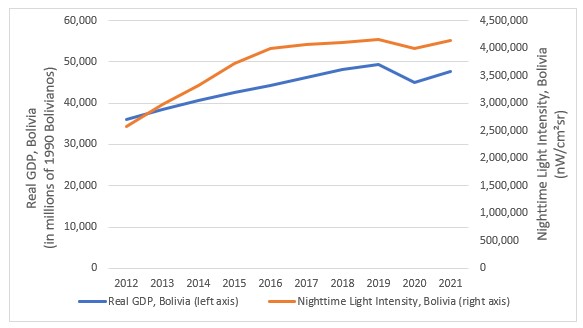
Source: Authors’ elaboration based on data from NASA’s Black Marble (Román et al., 2018) and INE.
Figure 2 shows that almost 70% of the pandemic drop was concentrated in the three metropolitan areas, with the metropolitan area of Santa Cruz as the most affected by the drop (more than half of it). Oruro also saw a substantial drop, while the remaining 317 municipalities together were responsible for less than 20% of the 2020 pandemic drop in nightlight intensity.
Figure 2: Municipalities that suffered most during 2020 (percentage distribution of the 2020 pandemic drop in nightlight intensity)
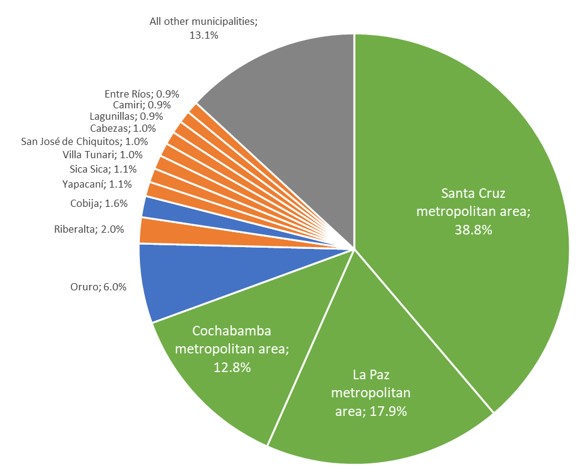
Source: Authors’ elaboration based on data from NASA’s Black Marble nightlight products.
However, some municipalities seemed to flourish rather than suffer during 2020. Figure 3 shows the 9 municipalities with the biggest increases in NTL intensity between 2019 and 2020. While the metropolitan areas of the central axis suffered greatly during the pandemic, the state capitals of Potosí, Sucre, Tarija, and Beni all saw increases in nightlight intensity between 2019 and 2020, as did Villamontes and Villa San Lorenzo of Tarija, and San Benito, Tolata and Arbieto of Cochabamba.
Figure 3: The 9 municipalities with the largest increases in nightlight intensity between 2019 and 2020
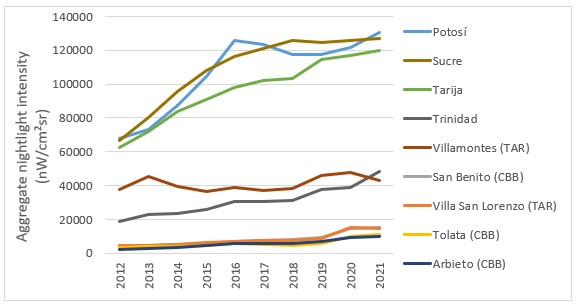
Source: Authors’ elaboration based on data from NASA’s Black Marble NTL product suite.
Thus, while the big metropolitan areas of the central axis tend to create the most opportunities for human flourishing during normal times, they also proved to be the most vulnerable when faced with a global pandemic.
Impressively, the cities of Potosí, Sucre, Tarija, and Trinidad proved to do well both during good times and during bad times.
References:
Román, M. O., Wang, Z., Sun, Q., Kalb, V., Miller, S. D., Molthan, A., Schultz, L., Bell, J., Stokes, E. C., Pandey, B., Seto, K. C., Hall, D., Oda, T., Wolfe, R. E., Lin, G., Golpayegani, N., Devadiga, S., Davidson, C., Sarkar, S., … Masuoka, E. J. (2018). NASA’s Black Marble nighttime lights product suite. Remote Sensing of Environment, 210, 113–143. https://doi.org/10.1016/j.rse.2018.03.017
This blog is part of the project INEQUALITREES – A Novel Look at Socio-Economic Inequalities using Machine Learning Techniques and Integrated Data Sources. For more information, please visit the project web-site: https://inequalitrees.eu/