
 Español
March 11th, 2020
The world population has been increasing greatly, growing from 2.6 billion in 1950 to 7.3 billion by 2015. The world population is estimated to reach 8.5 billion by 2030 [1]. Due to rural-urban migration, this growth is accompanied by an exponential population increase in cities. In 1960 the population residing in cities was 1.0 billion (33.6% of the total population), however, in 2018 that number had increased to 4.2 billion (55.3%) [2]. This rapid urbanization is putting pressure on the fresh water supply, wastewater treatment, living environment, and public health.
Traffic jams and air contamination are important problems that afflict cities, causing not only a loss of efficiency in economic activities as a result of time wasted stuck in traffic, but also serious environmental and health consequences.
The Sustainable Development Goal (SDG) number 11 (Sustainable Cities and Communities) aims to make cities and human settlements inclusive, safe, resilient and sustainable. To achieve this, cities must invest in public transportation. Specifically, Target 11.2 seeks to provide access to safe, affordable, accessible and sustainable transport systems for all by expanding public transportation.
For this reason, in the Municipal Atlas of the SDGs in Bolivia, we include an innovative indicator that measures the supply of collective transportation in each municipality.
The data was obtained from the National Statistical Institute (INE), based on the Municipal Tax Administration Registry Office (RUAT). The data includes the car fleet by municipality and vehicle class between 2003 and 2017.
During the construction of the indicator, we decided to consider only vehicles that are destined for collective transport, that is, that have the capacity to transport 10 or more passengers. That is why only the categories bus, microbus and minibus were included in the construction of the indicator. The analysis considers a potential seating capacity of 54 for buses, 29 for microbuses and 14 for minibuses [3].
After estimating the number of collective transport seats, we divided the result by the population of the respective municipality to have the number of available seats per thousand inhabitants. This analysis allows us to identify the municipalities with the greatest collective transport capacity.
In addition to the above mentioned privately owned buses, we also added the seats available in Mi Teleférico (cable cars operating in La Paz and El Alto as a system of public transportation), as well as in the PumaKatari and ChikiTiti buses (La Paz), and Wayna Bus (El Alto).
In the case of Mi Teleférico, the analysis was different because it has interurban lines between La Paz and El Alto. That is why we consider the number of cabins of each line and the location of each station to determine the seats available in each municipality. For example, for the Red line, with 109 cabins and three stations, we determined that a third of the cabins belong to El Alto and two-thirds to La Paz since the line has only one station in El Alto and two in La Paz. The following table shows the distribution of cabins in both cities according to each station’s location:
Table 1: Station and cabin distribution by Mi Teleférico line
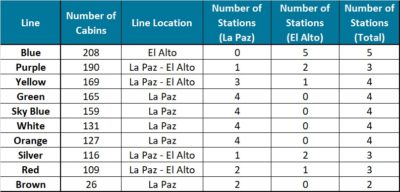
Source: Author’s elaboration based on data from Mi Teleférico.
The analysis allowed us to approximate the total number of seats available per thousand inhabitants of Mi Teleférico in both La Paz and El Alto, considering that each cabin has a maximum transport capacity of ten passengers.
The estimates of seats available for public transport provided by the PumaKatari, ChikiTiti and Wayna Bus were made in the same way as those based on RUAT data. All the existing vehicles in the municipality were considered: 179 PumaKatari buses and 30 ChikiTitis in La Paz and 60 Wayna Buses for El Alto. Likewise, the maximum transport potential of each of these vehicles was also used (61, 55 and 82, respectively) [4] [5].
The following graph shows the results for the ten municipalities with the largest number of seats available per thousand inhabitants, by type of collective transport. The municipality of Achocalla in La Paz is the one with the most available seats per 1000 inhabitants. Most collective transportation seats available come from minibuses.
Graph 1: Top 10 municipalities by number of available seats, by type of collective transport
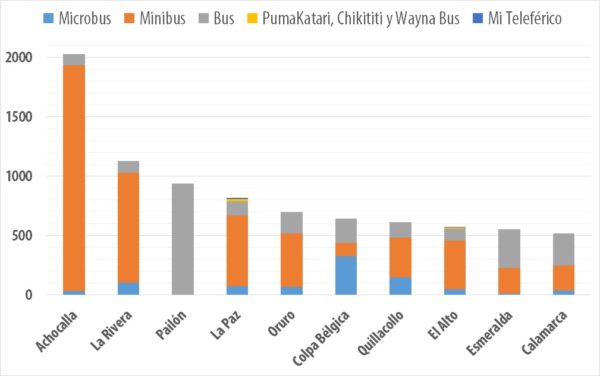
Source: Author’s elaboration based on SDG 11 results for the Municipal Atlas of the SDGs in Bolivia.
Finally, we use the methodology proposed by the SDSN office in Paris to estimate the thresholds of this indicator. It uses the average +/- half the Standard Deviation to define the ranges in which a municipality is considered to have reached the goal, is close to reaching it, still has significant challenges, or has great challenges. In Bolivia we consider that a municipality has reached the target if there are at least 93 seats available per thousand inhabitants. Despite the fact that this figure seems low, the results indicate that only 12% of Bolivian municipalities have managed to reach this goal, 6% are close to reaching it, while the remaining 82% still have significant/great challenges to reach this goal. Although initiatives such as Mi Teleférico, PumaKatari, ChikiTiti and Wayna Bus have helped increase public transportation supply, there is still a long way to go, especially considering the trends of population growth and migration to cities.
Notes
[1] https://www.un.org/es/sections/issues-depth/population/index.html
[2] https://data.worldbank.org/indicator/SP.URB.TOTL.IN.ZS
[3] El RUAT define a los autobuses como ómnibuses.
[5] https://amn.bo/2019/07/22/el-chikititi-unico-en-su-tipo-y-esta-hecho-a-la-medida-de-la-paz/
______
* Alejandra Gonzales Rocabado, Assitant Manager, SDSN Bolivia
The viewpoints expressed in the blog are the responsibility of the authors and do not necessarily reflect the position of their institutions. These posts are part of the project “Atlas of the SDGs in Bolivia at the municipal level” that is currently carried out by the Sustainable Development Solutions Network (SDSN) in Bolivia.