
 Español
April 16th, 2019
Energy consumption is closely related to income levels. The more readily usable energy and the more efficient energy converting technologies are available, the better are the conditions for the development of individuals, households, communities, the society and the economy (i). Electricity is one of the most useful and versatile energy forms available. It can be used for both heating and cooling, for producing light and sound, for running a wide variety of appliances, machinery, and vehicles, and even for creating money (e.g. bitcoins require huge amounts of electricity).
For these reasons, household electricity consumption is an excellent indicator of household income levels. Households with no access to electricity are almost certainly living in extreme poverty, with no basic household appliances, such as light bulbs and refrigerators, nor access to modern means of information and communication. When households get access to electricity, the first electrical appliances they obtain are usually a few light bulbs and a cell phone. If they can afford it, they will also add other items such as a radio and a refrigerator. If they have a bit more money, they might add a TV, a microwave oven, an iron, a shower heater and perhaps a computer. In general, the more appliances they can afford, the more electricity they will consume, so electricity consumption is a very good proxy for household income.
Indeed, one could even argue that electricity consumption is probably a better proxy for household income than reported household income itself. Reported household income suffers from a number of important problems, especially in countries like Bolivia with high levels of informality and self-employment. Most people don’t actually know how much they earned last month, and even if they did, they might be tempted to underreport it, or it might not be typical for the whole year. In contrast, electricity consumption is a hard, and relatively stable, number that is getting registered every month for every household with electricity access, at least in countries where electricity theft is not widespread.
Thus, if you have access to detailed electricity consumption data at the household level you can calculate several indicators crucial for tracking the SDGs, and you can calculate these indicators at a geographically highly disaggregated level, and at high frequency.
For example, you can calculate the level of inequality within each municipality, which has never been done before in Bolivia. The Centre for Social Research (CIS) of the Bolivian Vice-presidency is currently sponsoring a research project to do just that. The idea is very simple. In every municipality you use the electricity consumption data from every domestic electricity meter and add zero consumption observations for the households which do not have access to electricity, and then you plot the Lorenz curve and calculate a Gini coefficient (ii).
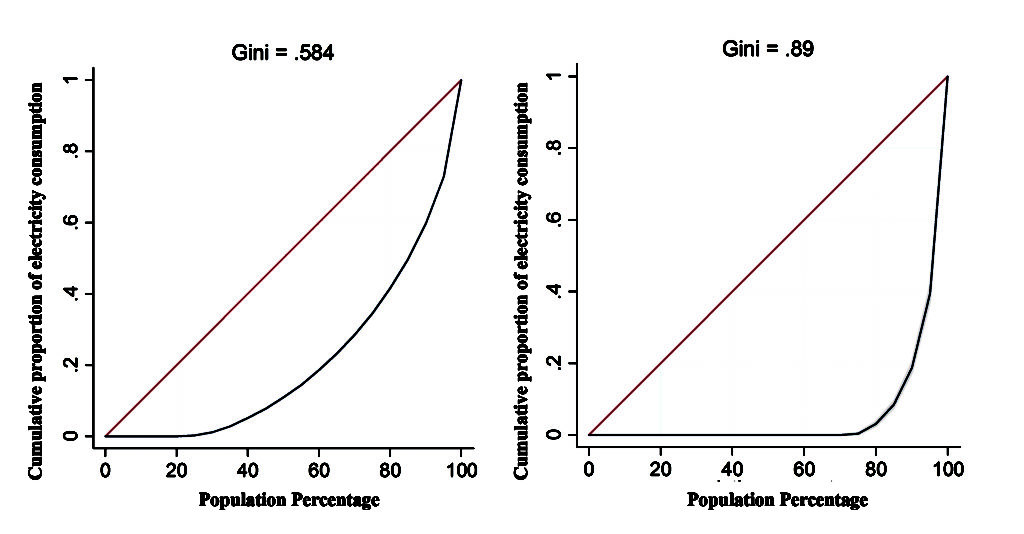
That would yield something like what is shown in Figure 1. To the left is the Lorenz curve and the Gini coefficient for a big urban municipality where everybody has access to electricity (although, surprisingly, more than 20% didn’t consume any electricity in the month of the reading (May 2016), so the homes appear to be uninhabited at the time of measurement). To the right are the Lorenz curve and Gini coefficient for a poor rural municipality with low electricity coverage and low consumption for the ones that actually do have access to the electricity grid.
Figure 1: Examples of electricity consumption Lorenz curves, 2016
(a) Santa Cruz de la Sierra (b) Tinguipaya
 Source: Andersen, Branisa & Calderón (2019)
Another interesting indicator related to poverty that can be calculated from the electricity consumption data is the percentage of households in each municipality that consume less than the national median consumption. This is an interesting indicator because it takes into account both the level of electricity consumption and the inequality of electricity consumption. Thus, two municipalities which have the same Gini coefficient, but have different levels of electricity consumption, will show a difference in this indicator. In the example of the poor rural municipality above, 99.7% of households consume less electricity than the national median (calculated using all domestic meters, but not including households without access). Thus, this is not only a municipality with very high Energy Inequality (Gini = 0.890) but also extremely high Energy Poverty (99.7%). In contrast, the highly urbanized municipality which secures electricity access for everybody has much lower Energy Inequality (Gini = 0.584) and much lower Energy Poverty (33.9%).
Electricity meters would be an ideal source of data for inequality and poverty indicators at the municipal level, except for a few practical problems. First of all, we do not know how many people are associated with each electricity meter. It is quite possible that the observations with 0 or very low energy consumption involve few inhabitants or inhabitants who live there only part of the year. Thus, both Energy poverty and Energy inequality measured this way at the household level would be exaggerated compared to conventional population-based poverty and inequality measures. The exaggeration would be particularly strong in areas where many families have two homes and use one of them only infrequently. The data from the infrequently used home would wrongly indicate a very poor family, whereas it might, in reality, be reflecting the electricity consumption of a second home to a family that migrated from the rural area to one of the bigger cities. This family might not want to lose its affiliation to the community where the home is located (iii). However, as long as the bias is similar across the country, the ranking of municipalities should be similar (iv).
In the case of Bolivia, there is a second problem with the electricity consumption data, which is that some electricity distributors do not register the municipality of the electricity meter in their databases, and in some cases it is not even well-defined, because municipal borders themselves are not well-defined. This has been a main obstacle in the CIS research project, but we finally have managed to clean up the databases and reach some reasonably accurate data for the great majority of the Bolivian municipalities.
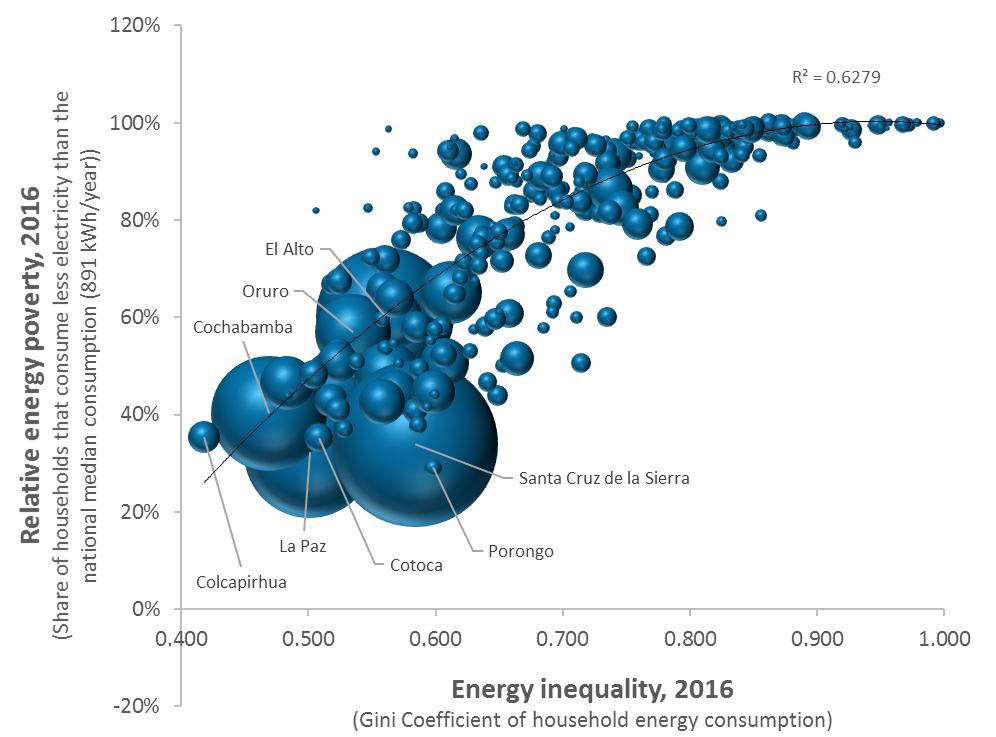
Figure 2 shows two of our main variables plotted against each other. It shows a strong positive relationship between Relative Energy Poverty and Energy Inequality. In the most favourable corner of the figure (lower left), with low Energy Inequality and low Relative Energy Poverty, we find the main cities in Bolivia, as well as the neighbouring municipalities that form part of the three large metropolitan areas of Bolivia. The municipality with the lowest level of Energy Inequality in Bolivia is Colcapirhua located between the well-established municipalities of Quillacollo and Cochabamba. The municipality with the lowest level of Relative Energy Poverty is Porongo, which forms part of the metropolitan area of Santa Cruz.
In the other corner of the figure (upper right), we find a large number of municipalities with extremely high levels of Energy Poverty and Energy Inequality. Fortunately, relatively few people live in these municipalities. The size of each bubble in Figure 2 reflects the number of households in each municipality.
Figure 2: Energy inequality and Relative Energy Poverty in Bolivia, 2016, by municipality
Source: Andersen, Branisa & Calderón (2019)
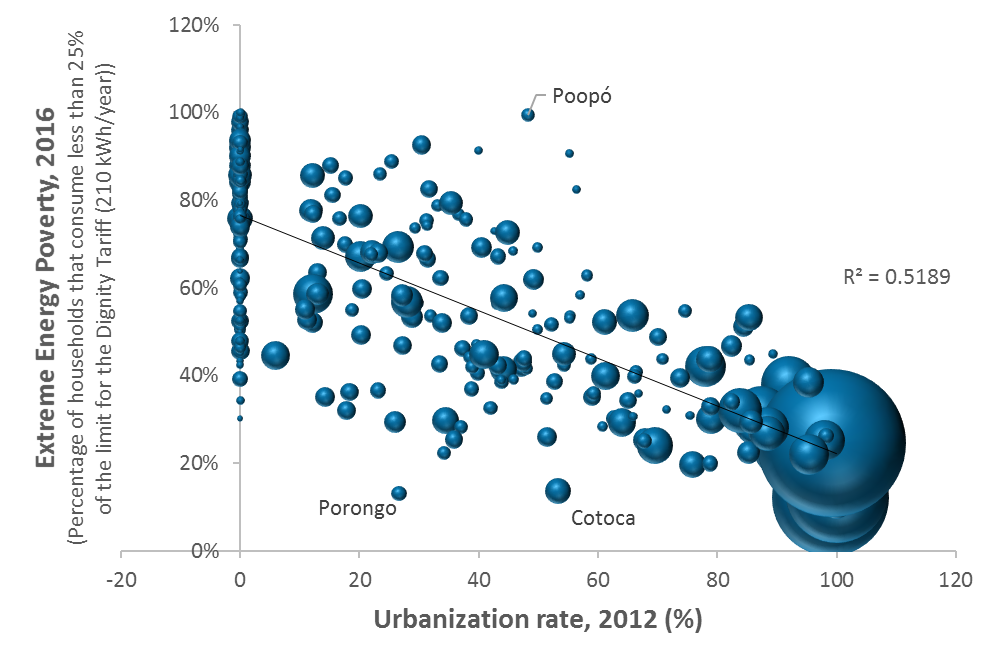
In addition to the Relative Energy Poverty rate we can also calculate an Extreme Energy Poverty rate, by calculating the percentage of households that consume less electricity than a bare minimum. We have chosen the bare minimum as the equivalent of a quarter of the limit for receiving the subsidized energy tariff (Tarifa Dignidad, which is 70 kWh per month). A quarter of that would allow a household to power a couple of light bulbs, a radio and a cell phone, but nothing more, so it is clearly a bare minimum.
Figure 3 plots Extreme Energy Poverty rates against Urbanization rates for almost all municipalities in Bolivia (v). There is a clear negative relationship, suggesting that urbanisation is associated with lower levels of Extreme Energy Poverty. This makes sense, as access to electricity is easier in more urbanised municipalities and as people living in more urbanized municipalities tend to have higher levels of income and can pay for the electricity they consume. Some municipalities, however, have managed to achieve low levels of Extreme Energy Poverty without being completely urbanized, but it helps being close to a big city, as suggested by the municipalities of Porongo and Cotoca, both part of the Santa Cruz metropolitan zone.
Figure 3: Urbanization versus Extreme Energy Poverty in Bolivia, 2016, by municipality
Source: Andersen, Branisa & Calderón (2019)
The map below shows with more clarity where municipalities with high Extreme Energy Poverty Rates are in Bolivia. The west, in the Highlands, pops out for an abundant quantity of red coloured municipalities, which represent those municipalities with 90% – 98% of households living under Extreme Energy Poverty conditions. There are a few municipalities coloured in green, which show rates between 11% and 35%. Those are mainly found in the east, as well as in Tarija, a department south of the country. Department capitals and the most significant metropolitan areas (Santa Cruz, La Paz and Cochabamba), also stand out for reduced Extreme Energy Poverty rates, except for Potosí and Pando.
Map 1. Extreme Energy Poverty Rates
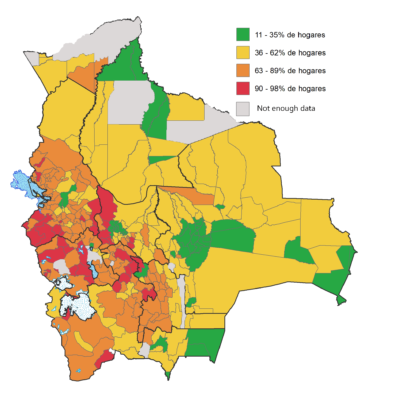
Source: Andersen, Branisa & Calderón (2019)
Through this CIS sponsored research project, the following municipal level indicators are being developed for potential inclusion in the Atlas of the SDGs in Bolivia at the municipal level:
- Relative Energy Poverty rate, 2016 (% of households consuming less than the national median, 891 kWh/year)
- Extreme Energy Poverty rate, 2016 (% of households consuming less than a quarter of the Tarifa Dignidad limit, 210 kWh/year)
- Energy Inequality, 2016 (Gini coefficient of household’s energy consumption)
- An estimate of the average household consumption per capita, 2016 (Bs. per person)
- Per capita carbon emissions from energy consumption, 2016 (tCO2/person/year)
———————————-
* Lykke E. Andersen, Ph.D., Executive Director of SDSN Bolivia at: Lykke.E.Andersen@sdsnbolivia.org
** Boris Branisa, Ph.D., Director, Instituto para el Desarrollo del Emprendimiento y la Competitividad (iDEC), Escuela de la Producción y la Competitividad (ePC), Universidad Católica Boliviana “San Pablo”.
*** Guillermo Guzmán Prudencio, Ph.D. Centro de Investigaciones Sociales (CIS) de la Vicepresidencia del Estado.
The viewpoints expressed in the blog are the responsibility of the authors and do not necessarily reflect the position of their institutions. These posts are part of the project “Atlas of the SDGs in Bolivia at the municipal level” that is currently carried out by the Sustainable Development Solutions Network (SDSN) in Bolivia, of which both iDEC and CIS are members.
————————————
Footnotes:
(i) https://energypedia.info/wiki/Energy_Poverty
(ii) The Lorenz curve is a graphical representation of the distribution of a variable, such as income. The curve is a graph showing the proportion of for example overall income assumed by the bottom x% of the people. The Gini coefficient measures the inequality among values of a frequency distribution. A Gini coefficient of zero expresses perfect equality, where all values are the same. A Gini coefficient of 1 (or 100%) expresses maximal inequality among values.
(iii) Law N°1715 of 1996, regulating the National Service of Agrarian Reform and Law N° 3545 of 2006, regulating the Community based Reconduction of the Agrarian Reform both guarantee the use and enjoyment of the agrarian property; however, they do not guarantee the free disposal of those lands. The endowment of agrarian property is tailored to benefit peasant communities and indigenous and, so-called, Originary communities. According to these laws, it is not possible to title agrarian property that is smaller than a “small property”. This prohibits owners of small parcels of land in the rural area to sell their lands if they so wanted. They are only allowed to transfer it to other members of their family by means of inheritance, therefore establishing a strong and almost unbreakable link between the rural community and the individual. This has an “eternal return” effect on the rural migrant who is bound to keep strong ties with his/her community through the land they inherited. This phenomenon is especially perceived in Bolivia’s high lands, where the amount of peasant communities and indigenous and Originary communities is larger.
(iv) In Bolivia, seasonal migration is common in many rural municipalities where the climate does not support agriculture all year round.
(v) We do not have electricity consumption data for 15 out of the 339 municipalities in Bolivia. These are mostly small municipalities in Pando and Beni, and together they are home to only about 0.4% of all households in Bolivia.