
 Español
April 3rd, 2019
This blog post is the first in a series that aim to contribute analysis, data and indicators to the upcoming Atlas of the SDGs in Bolivia at the municipal level coordinated by the Sustainable Development Solutions Network (SDSN) in Bolivia. The Atlas will provide a very detailed baseline on the situation of each of the 339 municipalities in Bolivia regarding each of the 17 Sustainable Development Goals. To secure that the Atlas includes the best possible indicators, based on the best available data, we encourage the feedback of our readers, many of whom are experts on one or more of the SDG topics in Bolivia.
In this blog, we will provide some long overdue data on deforestation in Bolivia. We will first give an overview of the evolution of annual deforestation in Bolivia over the period 1990-2017, and then we will provide more detailed information about where in Bolivia deforestation has been most rampant lately. The data has been put together from several different primary sources, all based on the interpretation of satellite images (1). Due to the various sources, the different periods are not strictly comparable, and all sources include some interpretation errors, but they still provide a good approximation of the general trend and the spatial distribution of deforestation in Bolivia.
Figure 1 shows how annual deforestation has increased in Bolivia from an average of about 150,000 hectares per year during the 1990s to almost 350,000 hectares per year during 2016-2017. These are averages over several years, since there is a lot of random variation from year to year, mostly due to climatic variations and the dynamics of land use, and these random variations obscure the overall trend. For example, 2016 represented the highest level of deforestation in Bolivia ever, with more than 417,000 hectares deforested, but the number fell to about 263,000 hectares in 2017. The averages over several years provide a better idea of the general trend.
Figure 1: Average annual deforestation in Bolivia, 1990-2017 (hectares/year)
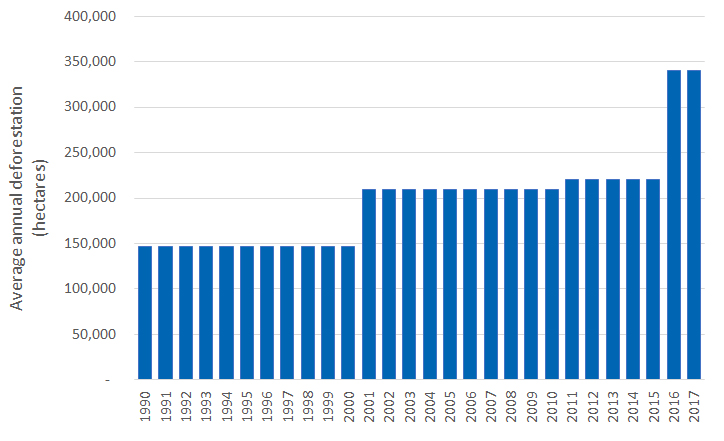
Source: Authors’ estimation based on sources listed in footnote (1).
In the rest of the blog, we will focus on the data from the last two years (averaging 2016 and 2017), and explore in more detail in which municipalities deforestation has been taking place recently.
We present the data in three different ways:
- Absolute levels of deforestation (hectares);
- Deforestation rates (annual deforestation as a per cent of forest in 2015), and
- Deforestation per capita (m2 deforested per inhabitant per year).
In each of the cases, we present the 25 municipalities with most deforestation in 2016-2017.
The blue column of Table 1 shows the 25 municipalities with the highest levels of deforestation in absolute terms (hectares per year). These 25 municipalities account for about 78% of total deforestation in Bolivia in 2016 and 2017. 16 of them, including the first 12, are located in the department of Santa Cruz, but there are also 5 from Beni, 3 from La Paz and 1 from Cochabamba.
The yellow column shows the 25 municipalities with the highest deforestation rates (% of 2015 forest cleared per year). 22 of the 25 municipalities with the highest deforestation rates are located in the department of Santa Cruz, while the remaining 3 are from Cochabamba and Pando.
Finally, the red column shows the 25 municipalities with the highest per capita deforestation rates (m2 per person per year). Again, most of them are from the department of Santa Cruz, but there are also a few from Beni, Pando and La Paz.
Table 1: The 25 Bolivian municipalities with the highest levels of deforestation in 2016-2017, according to three different deforestation indicators
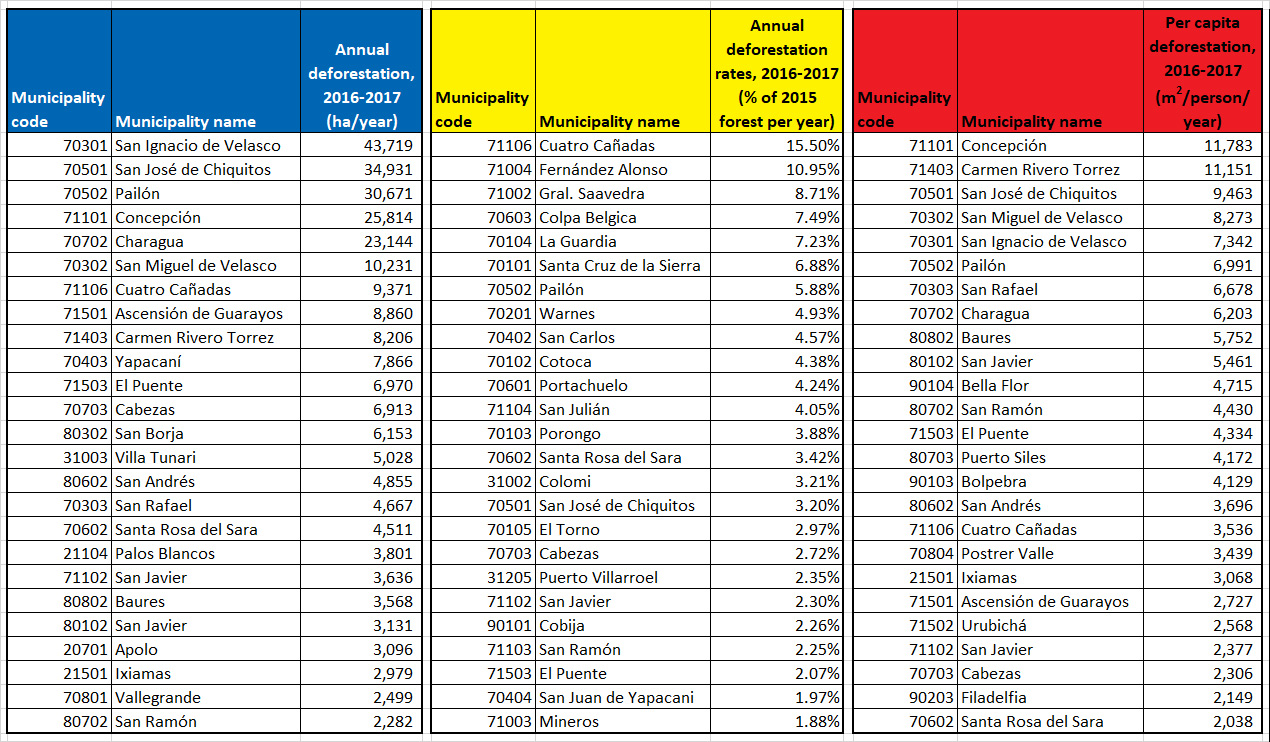
Source: Authors’ elaboration.
Table 1 shows three different ways of measuring the intensity of deforestation. High deforestation in absolute terms may be justified if you have a lot of people, but if a municipality makes it to the Top 25 on all three measures, that would undoubtedly be considered high deforestation by any standard, and it would have significant environmental impacts in the short term.
In total, 49 different municipalities have made it to one of the Top 25 lists of deforestation in Table 1 above, and 7 made it to all three lists. These seven municipalities with high deforestation, by any measure, are all located in the department of Santa Cruz, and they are the following:
- San José de Chiquitos
- Pailón
- Cuatro Cañadas
- El Puente
- Cabezas
- Santa Rosa del Sara
- San Javier
Map 1 shows in how many, and in which dimensions, each municipality in Bolivia have made it to one of the Top 25 lists above. Each dimension is represented by one of the primary colours (blue, yellow, red), but if a municipality appears on more than one list, it is coloured in the composite colour that arises from mixing the two primary colours. There are a lot of purple coloured municipalities, for example, which implies that they are both on the red list (high per capita deforestation) and the blue list (high absolute levels of deforestation). The seven municipalities that made it to all three lists are coloured in black.
Map 1: Municipalities that have made it to one or more of the three Top 25 lists, 2016-2017.
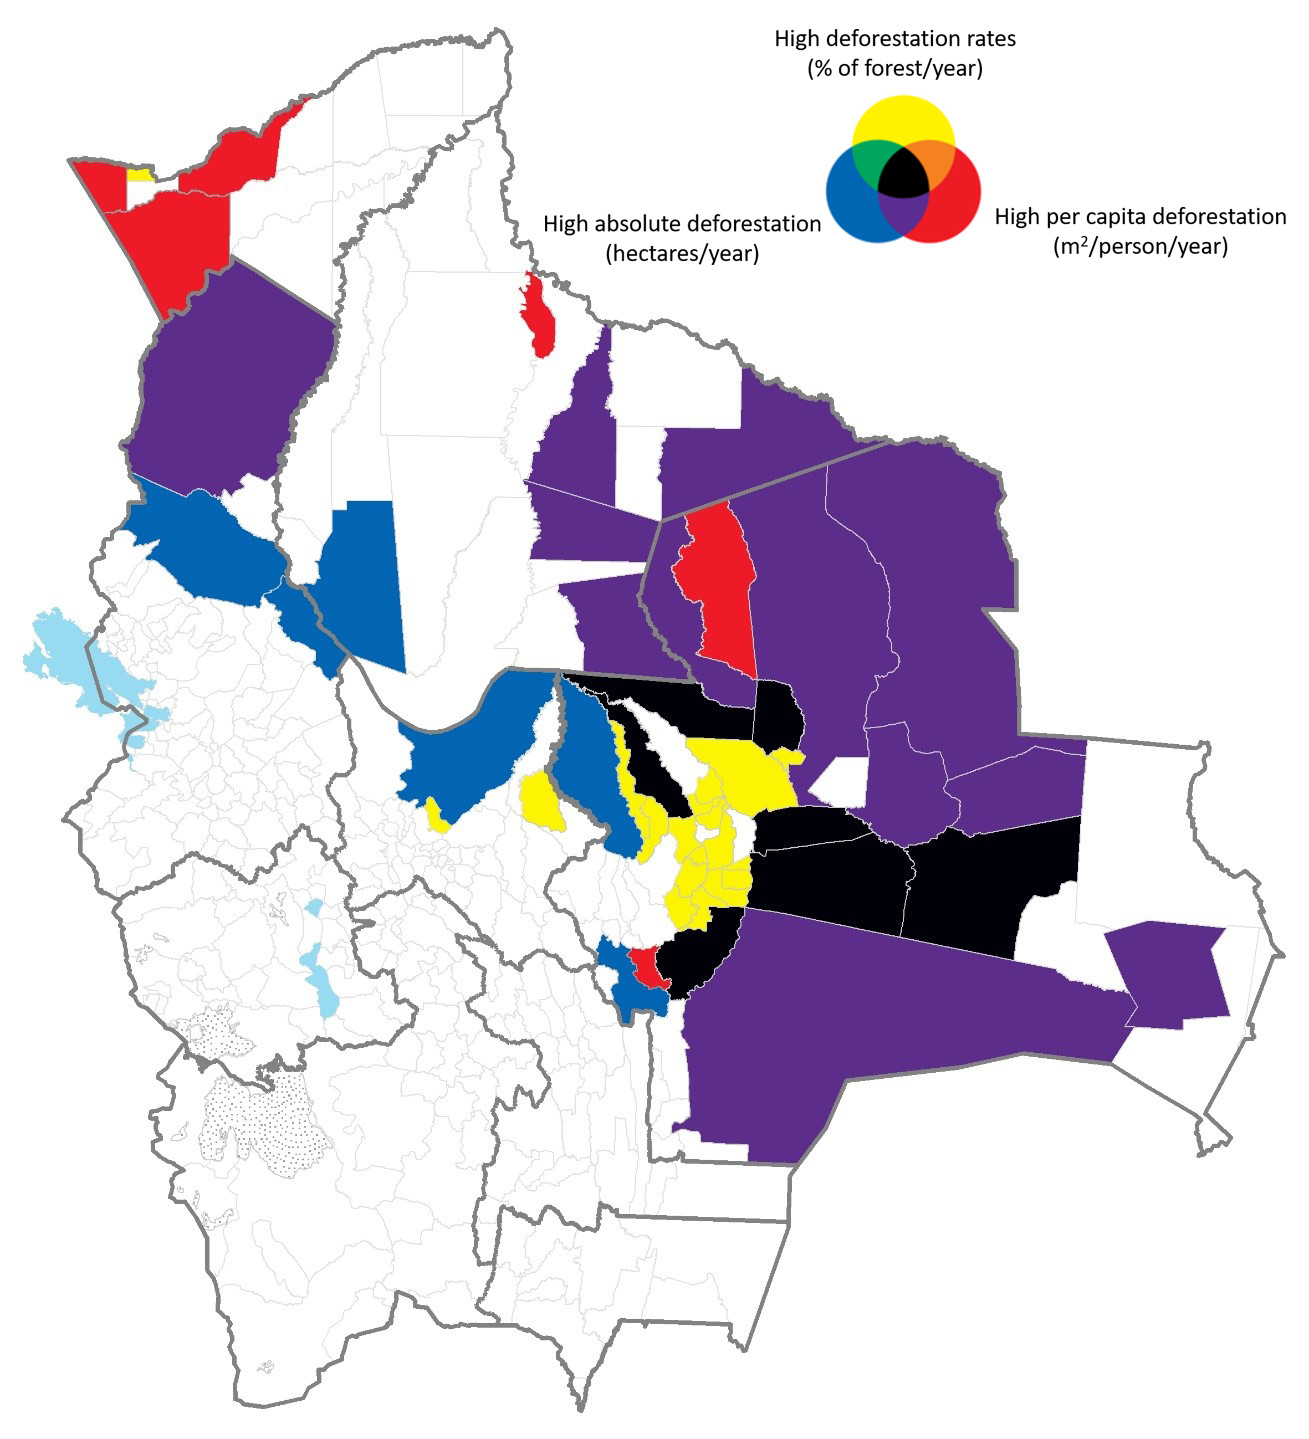 Source: Authors’ elaboration based on information in Tables 1-3 above.
The authors of this blog, who have both worked on deforestation in Bolivia for more than a decade, recommend that the following two indicators enter the Atlas of the SDGs in Bolivia at the municipal level under SDG15:
- Average annual per capita deforestation, 2016-2017 (m2/person/year)
- Average annual deforestation rate, 2016-2017 (% of forest area in 2015)
If anybody knows of more accurate data, however, we would love to hear about it.
———————————-
* Sustainable Development Solutions Network – Bolivia.
** Conservation International – Bolivia.
The Sustainable Development Solutions Network (SDSN) in Bolivia is currently preparing an Atlas of the SDGs in Bolivia at the municipal level. It is a significant collaborative effort involving many different institutions. The viewpoints expressed in the blog are the responsibility of the authors and may not reflect the position of their institutions. Readers are encouraged to provide feedback to the overall coordinator of the Atlas, Dr Lykke E. Andersen, Executive Director of SDSN Bolivia at Lykke.E.Andersen@sdsnbolivia.org.
————————————
- Data sources: Data for 1990-2010 are from SERNAP & CI (2013) Deforestación y regeneración de bosques en Bolivia y en sus Áreas Protegidas Nacionales para los periodos 1990-2000 y 2000-2010. La Paz: Servicio Nacional de Áreas Protegidas, Museo de Historia Natural Noel Kempff Mercado y Conservación Internacional – Bolivia. Data for 2011-2015 are from the Bolivian Ministry of Environment and Water (Sala de Observación – OTCA, Dirección General de Desarrollo Forestal y Autoridad de Bosques y Tierras 2017). Finally, data for 2016 and 2017 are from the Hansen Global Forest Change data set version 1.5.
Note: Only municipalities with more than 0.1 km2 of forest have been included in this analysis.