
 Español

August, 9th, 2022
Globally, food is responsible for about 26% of all greenhouse gas emissions, or roughly 14 billion tCO2eq per year (Ritchie, 2019). If we divide this number by the current global population of almost 8 billion people, we find that the average person emits about 1.75 tCO2eq per year just by eating (or throwing away food).
However, food emissions depend greatly on what you eat and how it was produced. Beef is widely known as a major villain (CDTM, 2021), and beef that is produced by clearing forest in the Amazon is among the worst (Cederberg et al., 2011).
In this article, we will calculate the average emissions from beef consumption in Bolivia for the period 2001-2020.
In Bolivia, because of the way beef is produced, there are two main sources of greenhouse gas emissions from beef production: 1) Methane emissions from enteric fermentation (the digestive process of the cattle), and 2) CO2 emissions from converting forest to pasture for the cattle.
In addition, there are many different sources of emissions along the supply chain until it reaches the final consumer, from slaughtering, processing, packaging, refrigeration, transportation, to cooking, but these are minor in comparison to the first two and will be ignored in this article.
Both imports and exports of beef were insignificant[1] in Bolivia until 2020 (ITC, 2022), so these will also be ignored, and for the purpose of emissions calculations we will assume that beef consumption in Bolivia is equal to beef production.
Methane emissions from cattle in Bolivia
According to Bolivia’s latest communication to the United Nations Framework Convention on Climate Change (UNFCCC), cattle-related methane emissions in 2008 amounted to 13.9 million tCO2eq (Estado Plurinacional de Bolivia, 2020). At that time, Bolivia had 7,786,802 heads of cattle (FAO, 2022), so each of them emitted about 1.787 tCO2eq per year. This factor can be assumed to be relatively stable over time and space, and allows us to calculate annual methane emissions from cattle in Bolivia as indicated in Table 1.
Table 1: Bolivian cattle herd, beef production and cattle methane emissions, 2001-2020
|
Year |
Cattle herd |
Beef production (tons) |
Methane emissions from cattle |
|
2001 |
6,500,096 |
160,943 |
11.6 |
|
2002 |
6,673,475 |
164,551 |
11.9 |
|
2003 |
6,851,256 |
168,226 |
12.2 |
|
2004 |
7,033,582 |
172,000 |
12.6 |
|
2005 |
7,217,507 |
175,000 |
12.9 |
|
2006 |
7,409,002 |
200,000 |
13.2 |
|
2007 |
7,586,526 |
244,375 |
13.6 |
|
2008 |
7,786,802 |
248,680 |
13.9 |
|
2009 |
7,985,230 |
202,026 |
14.3 |
|
2010 |
8,189,786 |
202,347 |
14.6 |
|
2011 |
8,400,439 |
205,187 |
15.0 |
|
2012 |
8,620,784 |
212,595 |
15.4 |
|
2013 |
8,847,434 |
215,179 |
15.8 |
|
2014 |
8,798,354 |
224,651 |
15.7 |
|
2015 |
8,948,602 |
243,000 |
16.0 |
|
2016 |
9,119,000 |
252,000 |
16.3 |
|
2017 |
9,304,000 |
260,000 |
16.6 |
|
2018 |
9,556,000 |
268,000 |
17.1 |
|
2019 |
9,741,474 |
266,499 |
17.4 |
|
2020 |
10,142,680 |
276,447 |
18.1 |
|
Average (2001-2020) |
8,235,601 |
218,085 |
14.7 |
Source: Authors’ calculations based on data from FAO (2022) and Estado Plurinacional de Bolivia (2020).
CO2 emissions from converting forest to pasture in Bolivia
Far more important than the methane emissions are the emissions from forests that were burned to create pasture for cattle.[2]
According to Global Forest Watch (2022), from 2001 to 2021, Bolivia lost 6.67 million hectares of tree cover, causing 3.01Gt of CO₂ emissions, or 451 tCO2/ha, on average. Not all of this is caused by cattle ranching, but a large part is. According to Müller et al. (2014), 51.9% of the deforestation experienced in Bolivia between 2000 and 2010 was caused directly by cattle ranching. No detailed studies are available for the 2010-2020 period, but the number of cattle has increased faster than the area of cropland during the latest decade (FAO, 2022), so there is no reason to suspect cattle ranching has become a less important driver of deforestation lately. For lack of more detailed information, we will assume that cattle ranching is responsible for 50% of deforestation in Bolivia every year during the last two decades. Table 2 presents the CO2 emissions from cattle-related deforestation using this simplifying assumption.
Table 2: CO2 emissions from cattle-related deforestation in Bolivia, 2001-2020
|
Year |
Total annual deforestation (Global Forest Watch) |
Deforestation caused by cattle ranching |
CO2 emissions from cattle-related deforestation |
|
2001 |
140,321 |
70,161 |
31.6 |
|
2002 |
178,808 |
89,404 |
40.3 |
|
2003 |
163,759 |
81,880 |
36.9 |
|
2004 |
203,251 |
101,626 |
45.8 |
|
2005 |
250,748 |
125,374 |
56.5 |
|
2006 |
216,314 |
108,157 |
48.8 |
|
2007 |
189,953 |
94,977 |
42.8 |
|
2008 |
369,851 |
184,926 |
83.4 |
|
2009 |
225,270 |
112,635 |
50.8 |
|
2010 |
451,759 |
225,880 |
101.9 |
|
2011 |
330,239 |
165,120 |
74.5 |
|
2012 |
273,544 |
136,772 |
61.7 |
|
2013 |
179,823 |
89,912 |
40.6 |
|
2014 |
256,901 |
128,451 |
57.9 |
|
2015 |
166,275 |
83,138 |
37.5 |
|
2016 |
470,601 |
235,301 |
106.1 |
|
2017 |
463,194 |
231,597 |
104.5 |
|
2018 |
301,856 |
150,928 |
68.1 |
|
2019 |
852,090 |
426,045 |
192.1 |
|
2020 |
429,780 |
214,890 |
96.9 |
|
Average (2001-2020) |
305,717 |
152,858 |
68.9 |
Source: Authors’ calculations based on data from Global Forest Watch (2022).
Total greenhouse gas emissions from beef consumption in Bolivia
Table 3 sums up total greenhouse gas emissions from cattle ranching and beef consumption in Bolivia between 2001 and 2020. Emissions from beef consumption averaged 384 kg of CO2eq per kg of beef produced/consumed.
Table 3: Total greenhouse gas emissions from cattle ranching and beef consumption in Bolivia, 2001-2020
|
Year |
Methane emissions from cattle |
CO2 emissions from cattle-related deforestation |
Total greenhouse gas emissions from beef consumption in Bolivia (million tCO2) |
Greenhouse gas emissions per kilo of beef consumption (kg CO2eq/kg) |
|
2001 |
11.6 |
31.6 |
43.3 |
269 |
|
2002 |
11.9 |
40.3 |
52.2 |
318 |
|
2003 |
12.2 |
36.9 |
49.2 |
292 |
|
2004 |
12.6 |
45.8 |
58.4 |
340 |
|
2005 |
12.9 |
56.5 |
69.4 |
397 |
|
2006 |
13.2 |
48.8 |
62.0 |
310 |
|
2007 |
13.6 |
42.8 |
56.4 |
231 |
|
2008 |
13.9 |
83.4 |
97.3 |
391 |
|
2009 |
14.3 |
50.8 |
65.1 |
322 |
|
2010 |
14.6 |
101.9 |
116.5 |
576 |
|
2011 |
15.0 |
74.5 |
89.5 |
436 |
|
2012 |
15.4 |
61.7 |
77.1 |
363 |
|
2013 |
15.8 |
40.6 |
56.4 |
262 |
|
2014 |
15.7 |
57.9 |
73.7 |
328 |
|
2015 |
16.0 |
37.5 |
53.5 |
220 |
|
2016 |
16.3 |
106.1 |
122.4 |
486 |
|
2017 |
16.6 |
104.5 |
121.1 |
466 |
|
2018 |
17.1 |
68.1 |
85.1 |
318 |
|
2019 |
17.4 |
192.1 |
209.6 |
786 |
|
2020 |
18.1 |
96.9 |
115.0 |
416 |
|
Average (2001-2020) |
|
|
|
384 |
Source: Authors’ calculations based on data from FAO (2022), Estado Plurinacional de Bolivia (2020), Müller et al. (2014), and Global Forest Watch (2022).
Bolivia’s beef emissions in perspective
Figure 1 shows that the emissions intensity of beef in Bolivia is almost 4 times higher than the average emissions intensity from beef consumption globally, mainly because Bolivian beef is associated with a lot of deforestation (on average 0.7 hectares of deforestation per ton of beef).
The figure also shows the average emissions intensity from other food products. These are global averages, but they are probably not very different in Bolivia. Thus, eating 1 kg of beef in Bolivia emits about 39 times more greenhouse gasses than eating 1 kg of chicken, and 767 times more than eating 1 kg of potatoes.
Figure 1: Greenhouse gas emissions per kg of food product (kgCO2eq/kg)
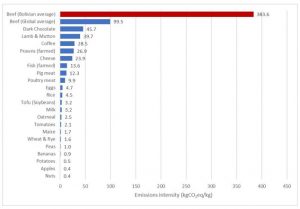
Source: Authors’ elaboration using data from Ritchie & Roser (2021) and own estimations from Table 3.
In 2020, Bolivians on average consumed about 23 kg of beef per person, up from 10 kg per person in 1961 (FAO, 2022). This means that an average person in Bolivia now emits 8.9 tons of CO2eq per year just from eating beef.
To put this number in perspective, consider that the average per capita emissions in the world from all sources is around 5 t CO2eq/person/year. Or another comparison: Eating just 100 grams of beef in Bolivia corresponds to driving about 213 km in a private car[3] alone.
A vegetarian in Bolivia could go on a Caribbean cruise 5 times every year (including flights to and from Miami) and still not cause as much greenhouse gas emissions as a person who eats 100 grams of beef every day for a year.[4]
Recommendations
There are two main options for reducing Bolivia’s extremely high emissions from cattle ranching and beef consumption: 1) Consume less beef, or 2) Produce beef without causing deforestation.
One of the options is in the hands of consumers, and the other is in the hands of producers. Both seem relatively easy changes for individuals and business to implement, but without incentives to do so, it probably won’t happen. Changes in both consumption and production patterns would be greatly facilitated by a public policy that strongly discouraged deforestation.
Unfortunately, public policy seems to go in the opposite direction, with plans to expand Bolivian beef production so as to export our high-emissions beef to other countries as well (Fundación Solon, 2021). Environmentally, this is about the worst possible option for replacing dwindling natural gas export revenues.
A potentially much better option would be to take advantage of the opportunity to receive compensation for reduced deforestation (several thousand dollars per hectare, if well negotiated) and use those funds to put Bolivia on a more sustainable development path, taking advantage of our spectacular natural and cultural resources without destroying them.
References
Castillo, S. (2017). How much carbon does cruise ship tourism emit?. Griffith Institute for Tourism Insights. https://blogs.griffith.edu.au/institute-for-tourism/how-much-carbon-does-cruise-ship-tourism-emit/
CDTM – The Center for Digital Technology and Management. (2021). Holy Cow! The environmental cost of your food choice. https://www.cdtm.de/2021/07/20/environmental-cost-food-choice/
Cederberg, C., Persson, U. M., Neovius, K., Molander, S., & Clift, R. (2011). Including carbon emissions from deforestation in the carbon footprint of Brazilian beef. https://pubs.acs.org/doi/10.1021/es103240z
C Level. (n.d.). Flight Carbon Calculator. https://www.clevel.co.uk/flight-carbon-calculator/#s-two
Estado Plurinacional de Bolivia (2020). Tercera Comunicación Nacional de Estado Plurinacional de Bolivia. Ante la Convención Marco de las Naciones Unidas sobre Cambio Climático. Ministerio de Medio Ambiente y Agua y Autoridad Plurinacional de la Madre Tierra. https://unfccc.int/sites/default/files/resource/NC3%20Bolivia.pdf
FAO – Food and Agriculture Organization of the United Nations. (2022). Data sets, Crops and livestock products. https://www.fao.org/faostat/en/#data/QCL
Fundación Solón, (2021). El cuento chino de la exportación de carne boliviana. https://fundacionsolon.org/2021/10/04/el-cuento-chino-de-la-exportacion-de-carne-boliviana/
Global Forest Watch, (2021). Bolivia, Cambio Forestal. https://www.globalforestwatch.org/dashboards/country/BOL/
IDAE, (n.d.). Consumo y emisiones de CO2. https://coches.idae.es/consumo-de-carburante-y-emisiones
Ministry of Rural Development and Lands (2013). Boletín informativo carne de res. https://siip.produccion.gob.bo/noticias/files/123_0406201472doc_07CARNDE%20DE%20RES.pdf
Müller, R., Pacheco, P., & Montero, J. C. (2014). El contexto de la deforestación y degradación de los bosques en Bolivia: Causas, actores e instituciones (Vol. 100). CIFOR. https://pdfs.semanticscholar.org/262f/bddd315cf882789e751cd12bf2addda1b25e.pdf
My Climate – Shape our future. (n.d.). Offset your flight emissions!. https://co2.myclimate.org/en/flight_calculators/new
Ritchie, H. (2019). Food production is responsible for one-quarter of the world’s greenhouse gas emissions. Our World in Data. https://ourworldindata.org/food-ghg-emissions
Ritchie, H., & Roser, M. (2019). Meat and Dairy Production. Our World in Data. https://ourworldindata.org/meat-production
Ritchie, H., & Roser, M. (2019). Environmental Impacts of Food Production. Our World in Data. https://ourworldindata.org/environmental-impacts-of-food
ITC – International Trade Center (2022). TRADE MAP. https://www.trademap.org/Index.aspx
[1] If we consider both exports and imports of beef, the average amount of meat consumption per person (kg/year), varies from 21.0 to 20.9, an insignificant change.
[2] This not only releases the carbon stored in forest biomass, but also prevents the absorption of new CO₂ emissions. Furthermore, it has impact in the loss of biodiversity, the variation of the hydrological cycle, the local weather, among others.
[3] On average, driving a car for 100 km generates 18.5 kilos of CO2 (IDAE, n.d.). This means that if a person drives 100 km per day for a year, their emissions from the use of their private vehicle would reach 6,738 kg of CO2. In comparison, 100 grams of meat produces 39.3 kg of CO2eq, implying that if a person consumes 100 grams of beef per day, the emission for a year would be equivalent to 14,345 kg of CO2eq from meat consumption alone.
[4] The average emissions from a roundtrip plane trip from Santa Cruz to Miami corresponds to 1.6 tons of CO2 per passenger (C Level, n.d.; My Climate, n.d). On the other hand, the average emissions of a cruise in the Caribbean for a week corresponds to 0.83 tons per person (Castillo, 2017). Making a total of 2,420 kg of CO2. Eating 100 grams of beef per day for a year (14,345 CO2eq) is thus emits 5.9 times more greenhouse gas emissions than the roundtrip flight and cruise.
Check Mauricio Foronda’s interactive analysis of the data
Analysis